23 Jul
Bollinger Bands are one of the most widely used technical indicators in trading. Developed by John Bollinger in the 1980s, they help traders identify volatility, overbought and oversold conditions, and potential trend reversals.
In this guide, you’ll learn:
- What Bollinger Bands are
- How to calculate and interpret them
- Trading strategies using Bollinger Bands
- Tips to improve accuracy and reduce false signals
Start Our Crypto & Forex Screener Dashboard For Free
What are Bollinger Bands?
Bollinger Bands consist of three lines:
- Middle Band (Simple Moving Average – SMA): A standard moving average, typically a 20-period SMA.
- Upper Band: The middle band plus twice the standard deviation.
- Lower Band: The middle band minus twice the standard deviation.
Formula
- Middle Band (MB) = 20-period SMA
- Upper Band (UB) = MB + (2 × Standard Deviation)
- Lower Band (LB) = MB – (2 × Standard Deviation)
Key Concepts
- Volatility Measurement: The bands expand when volatility is high and contract when volatility is low.
- Mean Reversion: Prices tend to return to the middle band.
- Breakout Signals: When price touches the upper or lower bands, it can indicate an overbought or oversold market.

Bollinger Bands Components
Bollinger Bands are made up of three key components: the Middle Band, Upper Band, and Lower Band. Each plays a crucial role in analyzing price action, volatility, and potential trade opportunities. Let’s dive deeper into how each component works and how traders use them effectively.
Explore more: Advanced Technical Analysis: Using Divergences and Convergences for Precision Trading
1. Middle Band (Simple Moving Average – SMA)
- The middle band is a 20-period simple moving average (SMA) by default.
- It represents the average price over a given period.
- The middle band acts as a trend indicator, helping traders identify price direction.
Trading Uses of the Middle Band
✅ Trend Direction:
- When price is above the middle band, the trend is bullish.
- When price is below the middle band, the trend is bearish.
✅ Dynamic Support and Resistance:
- The middle band acts as a support level in an uptrend.
- The middle band acts as a resistance level in a downtrend.
- Traders use it to enter trades on pullbacks.
Example Strategy Using the Middle Band
- In an uptrend, wait for price to retrace to the middle band and then buy when it bounces.
- In a downtrend, wait for price to retrace to the middle band and then sell when it rejects.
2. Upper Band (Overbought Signal & Breakouts)
- The upper band is calculated as: Upper Band=SMA+(2×Standard Deviation)Upper\ Band = SMA + (2 \times Standard\ Deviation)
- It represents a resistance zone where price might be overbought.
- A move above the upper band suggests strong momentum.
Trading Uses of the Upper Band
✅ Overbought Condition:
- If price touches or exceeds the upper band, it may be overbought.
- Look for bearish candlestick patterns (e.g., Doji, Shooting Star) to confirm reversal trades.
✅ Trend Continuation (Bollinger Band Walk):
- In a strong uptrend, price can ride the upper band.
- Instead of reversing, price clings to the upper band for extended periods.
- This indicates strong momentum, and traders should stay in long positions.
Example Strategy Using the Upper Band
- Reversal Trading: If price touches the upper band + RSI is above 70 → Consider shorting.
- Trend Continuation: If price rides the upper band + volume is increasing → Stay in long positions.
3. Lower Band (Oversold Signal & Breakouts)
- The lower band is calculated as: Lower Band=SMA−(2×Standard Deviation)
- It represents a support zone where price might be oversold.
- A move below the lower band suggests high volatility or selling pressure.
Trading Uses of the Lower Band
✅ Oversold Condition:
- If price touches or falls below the lower band, it may be oversold.
- Look for bullish candlestick patterns (e.g., Hammer, Engulfing) to confirm reversal trades.
✅ Trend Continuation (Bollinger Band Walk):
- In a strong downtrend, price can ride the lower band.
- Instead of reversing, price stays near the lower band, signaling strong selling momentum.
Example Strategy Using the Lower Band
- Reversal Trading: If price touches the lower band + RSI is below 30 → Consider buying.
- Trend Continuation: If price rides the lower band + MACD confirms bearish momentum → Stay in short positions.
Read more: FXonbit CandleStick Pattern Finder Service: Your Gateway to Smarter Forex and Crypto Trading

Putting It All Together – Bollinger Bands Trading Strategy
Strategy: Bollinger Band Reversal + RSI Confirmation
-
Identify Overbought/Oversold Levels:
- Overbought: Price touches the upper band + RSI above 70.
- Oversold: Price touches the lower band + RSI below 30.
-
Look for Confirmation:
- Candlestick patterns (Doji, Hammer, Engulfing).
- Divergence in RSI or MACD.
-
Enter the Trade:
- Buy if the price is oversold and showing bullish reversal signs.
- Sell if the price is overbought and showing bearish reversal signs.
-
Set Stop Loss and Take Profit:
- Stop Loss: Place it slightly beyond the upper/lower band.
- Take Profit: Middle band or opposite band.
Bollinger Bands are a powerful trading tool when used correctly. The middle band acts as a dynamic trend indicator, while the upper and lower bands help identify overbought and oversold conditions. Combining Bollinger Bands with RSI, MACD, or price action analysis improves accuracy and reduces false signals.
Read more: Mastering Ichimoku Cloud Trade; Specialized Topics

Explanation of the Chart
- Middle Band (Green Dashed Line): The 20-period Simple Moving Average (SMA).
- Upper Band (Red Dashed Line): The SMA + 2 standard deviations.
- Lower Band (Blue Dashed Line): The SMA – 2 standard deviations.
- Candlestick Chart (Black Line): Represents stock price movements.
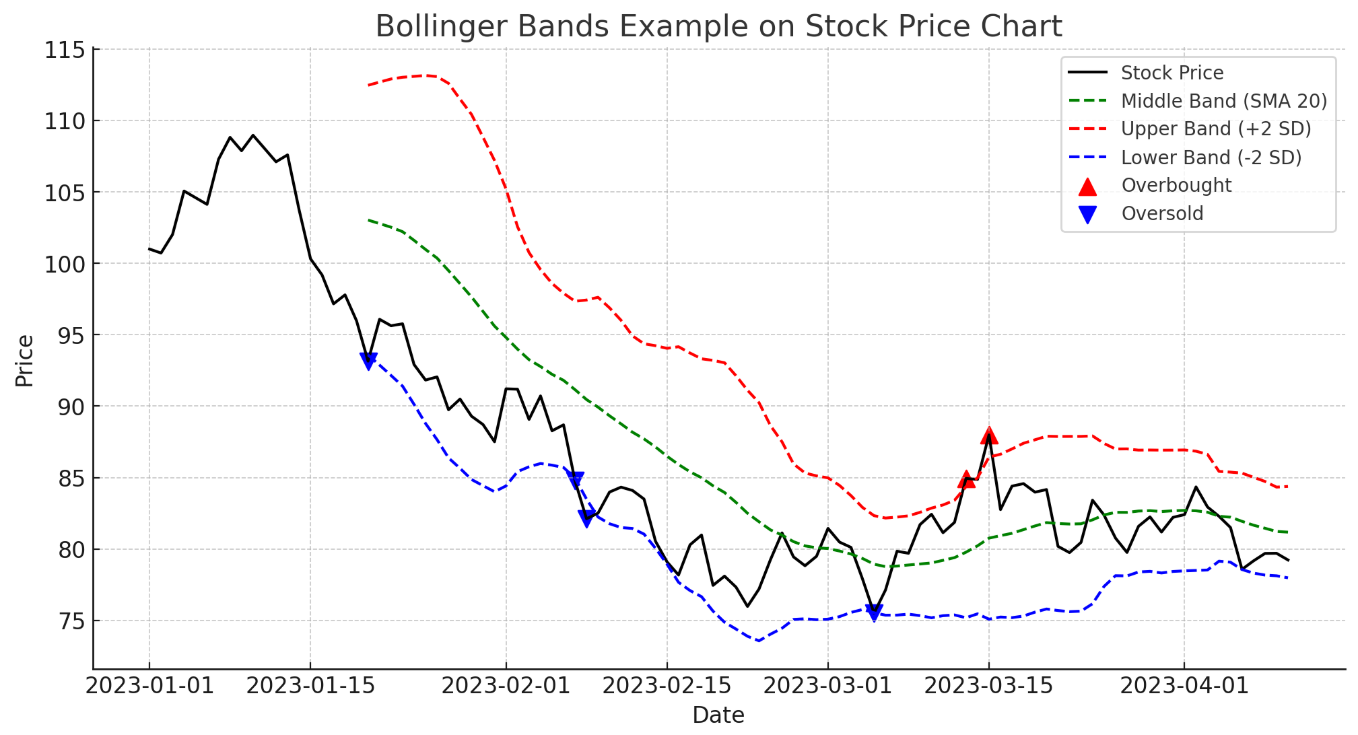
Bollinger Bands Interpretation
-
Overbought Condition (Red Markers – Upward Arrows):
- When the price touches or exceeds the upper band, it may indicate an overbought market.
- This can be a potential sell signal if supported by other indicators.
-
Oversold Condition (Blue Markers – Downward Arrows):
- When the price touches or drops below the lower band, it may indicate an oversold market.
- This can be a potential buy signal if confirmed by other indicators like RSI or MACD.
-
Trend Confirmation:
- If the price rides the upper band, it signals a strong uptrend (bullish momentum).
- If the price rides the lower band, it indicates a strong downtrend (bearish momentum).
Read more: What is Crypto Whale Tracker? How FXonbit Empowers You to Follow Market Giants
![]()
Bollinger Bands Trading Strategies: Bollinger Bounce & Bollinger Squeeze
Bollinger Bands are a powerful technical analysis tool used to identify volatility, overbought/oversold conditions, and trend breakouts. Below are two essential trading strategies that leverage Bollinger Bands effectively.
1. Bollinger Bounce Strategy (Mean Reversion)
This strategy is based on the principle that prices tend to revert to the mean (middle band) after touching the upper or lower Bollinger Bands. It works best in range-bound markets where there is no strong trend.
How It Works
- Buy Setup: When the price touches the lower Bollinger Band, indicating oversold conditions.
- Sell Setup: When the price touches the upper Bollinger Band, indicating overbought conditions.
- Stop-Loss: Set just below the lower band for buy trades and just above the upper band for sell trades.
- Take-Profit: The middle band (20-period SMA) serves as the profit target.
Example Trading Plan
- Wait for price to touch the lower Bollinger Band.
- Confirm the reversal using an additional indicator (e.g., RSI < 30 or bullish candlestick patterns).
- Enter a buy trade and set a stop-loss below the recent swing low.
- Exit at the middle Bollinger Band (20-period SMA) or let the trade run until signs of reversal appear.
✅ Best Market Conditions: Sideways or ranging markets.
❌ When to Avoid: In strong trends where price continues riding the bands.
Chart Pattern: How to Trade the Ascending Channel?
2. Bollinger Squeeze Strategy (Breakout Trading)
The Bollinger Squeeze occurs when the Bollinger Bands contract tightly, indicating a period of low volatility. This signals that a high volatility breakout is likely to follow.
How It Works
- Identify a squeeze: The bands become narrow, showing reduced volatility.
- Watch for a breakout: Price movement outside the bands signals a potential trend start.
- Enter the trade:
- Buy if the price breaks above the upper band.
- Sell if the price breaks below the lower band.
- Stop-Loss: Set below the breakout candle for buys and above for sells.
- Take-Profit: Use previous resistance/support levels or a trailing stop.
Example Trading Plan
- Identify a Bollinger Band squeeze where the bands are tightening.
- Wait for price to break out above the upper band (for a bullish move) or below the lower band (for a bearish move).
- Confirm the breakout using an additional indicator like MACD or volume increase.
- Enter a trade in the breakout direction and set a stop-loss at the opposite band or recent swing point.
- Use a trailing stop-loss or take profit at the next key resistance/support level.
✅ Best Market Conditions: Before major news events or consolidation phases.
❌ When to Avoid: During false breakouts (confirm with volume indicators).
- The Bollinger Bounce Strategy works well in ranging markets where price reverts to the mean.
- The Bollinger Squeeze Strategy helps traders catch powerful breakouts by identifying volatility contraction.
- Confirmation tools like RSI, MACD, and volume analysis can improve accuracy.
Explore more: How to Use Volume to Confirm Market Trends and Read Market Sentiment

Read more: What Is the Relative Strength Index (RSI)
How Bollinger Bands Work in Trading
Bollinger Bands are a dynamic indicator that adapts to market conditions by measuring volatility, identifying overbought/oversold levels, and helping traders confirm trend direction. Understanding these components can enhance trading accuracy and decision-making.
1. Volatility & Band Expansion/Contraction
- Bollinger Bands expand when market volatility is high.
- Bollinger Bands contract when market volatility is low.
- This feature helps traders anticipate breakouts and adjust risk management accordingly.
Trading Implications:
- Wide Bands: Increased volatility, often after news events or major market moves.
- Narrow Bands: Low volatility, typically before a strong breakout.
📌 Pro Tip: A Bollinger Squeeze (when bands are extremely tight) is a strong signal that a breakout is imminent.
2. Overbought & Oversold Conditions
- Overbought Condition: When price touches or exceeds the upper Bollinger Band, the asset may be overbought.
- 🚩 Possible sell signal if confirmed by bearish indicators like RSI > 70.
- Oversold Condition: When price touches or falls below the lower Bollinger Band, the asset may be oversold.
- ✅ Possible buy signal if confirmed by bullish indicators like RSI < 30.
Trading Implications:
- If price frequently touches the upper band without breaking out, it may indicate buyer exhaustion.
- If price frequently touches the lower band without breaking down, it may indicate seller exhaustion.
📌 Pro Tip: Use candlestick patterns like Doji, Engulfing, or Hammer for stronger confirmation.
3. Trend Identification Using Bollinger Bands
Bollinger Bands also help in recognizing trend direction based on price interaction with the bands.
- Uptrend Confirmation: If the price continuously rides the upper Bollinger Band, it signals strong bullish momentum.
- Downtrend Confirmation: If the price consistently stays near the lower Bollinger Band, it indicates strong bearish momentum.
Trading Implications:
- Price hugging the upper band → Stay in long trades.
- Price hugging the lower band → Stay in short trades.
- Breakouts beyond the bands → Trend acceleration or reversal potential.
📌 Pro Tip: Combine with a moving average crossover (e.g., 50 EMA) to confirm trend strength.
By understanding how Bollinger Bands expand, contract, and interact with price, traders can:
✔ Identify high-probability trade setups
✔ Avoid false breakouts by confirming with volume and momentum indicators
✔ Improve trend-following and mean-reversion trading strategies
Explore more: Understanding Volume in Trading: A Beginner’s Guide

Bollinger Bands Practical Example
Key Observations from the Chart
-
Buy Signal (Oversold Condition) – Blue Markers
- The price touches the lower Bollinger Band and then starts moving upwards.
- This suggests an oversold condition and a potential buying opportunity.
-
Bollinger Band Squeeze (Low Volatility Phase)
- The bands contract, indicating a low volatility phase.
- This warns traders to prepare for an imminent breakout.
-
Breakout Signal (New Trend Confirmation) – Red Markers
- The price breaks above the upper Bollinger Band, confirming bullish momentum.
- This signals the start of a new uptrend, prompting a long entry.
Read it: 40 Powerful Candlestick Patterns in Forex and Crypto Trading
How to Trade This Setup
- Buy when price touches the lower band and shows signs of reversal (confirmation via RSI or price action).
- Monitor for a squeeze, as this precedes a strong breakout.
- Enter a long position if price breaks above the upper band, confirming an uptrend.
- Set a stop-loss below the recent support level and use a trailing stop to maximize profits.
By effectively using Bollinger Bands, traders can analyze market volatility, spot key entry/exit points, and improve trade execution.
Chart Pattern: Descending Channel Pattern: A Comprehensive Guide

Detailed Trading Strategies Using Bollinger Bands
Bollinger Bands are a versatile tool used in various trading strategies. Below are detailed explanations of some popular strategies, including entry and exit points, and practical examples.
1. Bollinger Bounce
Concept:
- The Bollinger Bounce strategy is based on the idea that prices tend to revert to the mean, which is represented by the middle band (20-period SMA).
Strategy:
- Buy: When the price touches or goes below the lower band, it is considered oversold. Traders can look for buying opportunities.
- Sell: When the price touches or goes above the upper band, it is considered overbought. Traders can look for selling opportunities.
Example:
- Suppose a stock’s price touches the lower Bollinger Band. You enter a long position, anticipating the price will revert to the middle band. You set a stop-loss just below the recent low to manage risk. As the price rises and reaches the middle band, you consider taking profits.
Explore more: Crypto Grid Trading Strategy Ultimate Guide for Profitable Market Trading

2. Bollinger Squeeze
Concept:
- The Bollinger Squeeze occurs when the bands are very close together, indicating a period of low volatility. This is often followed by a significant price movement.
Strategy:
- Identify Squeeze: Look for the bands to contract, indicating reduced volatility.
- Entry Point: Enter a trade when the price breaks out above the upper band (for a long position) or below the lower band (for a short position).
Example:
- You notice the Bollinger Bands on a stock have narrowed significantly. You set a buy order above the upper band and a sell order below the lower band. The price breaks out above the upper band, triggering your buy order. You ride the upward trend and set a trailing stop to lock in profits.
Read this: The Best Martingale Strategy for Trading

3. Double Bottom with Bollinger Bands
Concept:
- This strategy looks for a double bottom pattern, where the second bottom is outside the lower Bollinger Band, and the first bottom is inside the band.
Strategy:
- Identify Double Bottom: Look for two distinct lows forming a W-shape, with the second low outside the lower band and the first low inside the band.
- Buy Signal: Enter a long position when the price moves back above the lower band after the second low.
Example:
- A stock forms a double bottom pattern. The first bottom is within the lower Bollinger Band, and the second bottom is outside. As the price moves back above the lower band after the second bottom, you enter a long position, anticipating a bullish reversal.
Explore more: MACD Divergence: A Comprehensive Guide for Traders

4. Riding the Bands
Concept:
- In strong trends, the price can “ride” the upper or lower Bollinger Band for extended periods.
Strategy:
- Identify Trend: Confirm a strong trend by seeing the price consistently touch or stay near the upper band (for an uptrend) or the lower band (for a downtrend).
- Entry Point: Enter a trade in the direction of the trend when the price touches the band.
- Exit Point: Stay in the trade as long as the price stays near the band. Consider exiting when the price moves away from the band.
Example:
- You notice a stock in a strong uptrend, with the price consistently touching the upper Bollinger Band. You enter a long position each time the price touches the upper band, setting stop-losses just below the middle band. You stay in the trade as long as the price remains near the upper band, taking profits when the price starts to move away.

Tips for Using Bollinger Bands Effectively
- Combine with Other Indicators: Use Bollinger Bands alongside other indicators like RSI, MACD, or moving averages to confirm signals and enhance reliability.
- Adjust Settings: Customize the Bollinger Bands settings (e.g., period length and standard deviation) to fit the specific asset and time frame you are trading.
- Risk Management: Always use stop-loss orders to manage risk, especially when trading breakouts or in volatile markets.
- Backtesting: Test the strategies on historical data to understand their effectiveness before applying them in live trading.
By understanding and applying these Bollinger Bands strategies, traders can better navigate market volatility, identify potential trading opportunities, and make more informed decisions.
Explore more: What is Forex Screener? Free Trading Opportunities with a Comprehensive Tool

Check Our Free Crypto Screener
How to Use Bollinger Bands in Trading
1. Bollinger Band Squeeze
A squeeze occurs when the bands contract, signaling low volatility. This often precedes a breakout. Traders watch for a strong move beyond the bands to identify potential trade setups.
How to Trade the Squeeze
- Entry: Wait for a breakout above the upper band (buy) or below the lower band (sell).
- Stop Loss: Place a stop just inside the bands to avoid false breakouts.
- Take Profit: Use support/resistance levels or a trailing stop.
2. Bollinger Band Reversal (Mean Reversion)
When the price touches the upper or lower band, it may indicate overbought or oversold conditions, suggesting a potential reversal.
How to Trade Mean Reversion
- Buy Setup: When price touches the lower band and shows bullish confirmation (e.g., hammer candlestick).
- Sell Setup: When price touches the upper band and forms a bearish confirmation (e.g., shooting star).
- Stop Loss: Below/above the previous swing low/high.
- Target: Middle band or opposite band.
3. Bollinger Band Trend Trading
When the price moves along the upper or lower band, it signals strong momentum.
How to Trade the Trend
- Uptrend: Buy when price bounces off the middle band and moves towards the upper band.
- Downtrend: Sell when price retraces to the middle band and moves toward the lower band.
- Exit: Use moving averages or a trailing stop.
4. Bollinger Bands with RSI
Combining Bollinger Bands with the Relative Strength Index (RSI) can help confirm signals.
- Buy Signal: Price touches the lower band + RSI below 30.
- Sell Signal: Price touches the upper band + RSI above 70.
Tips to Improve Bollinger Bands Trading
- Avoid using Bollinger Bands alone – Combine with RSI, MACD, or volume analysis.
- Beware of false breakouts – Use confirmation indicators.
- Adjust settings – 20-period SMA with 2 standard deviations is common, but customization may improve accuracy.
- Use different timeframes – Confirm setups with higher timeframes.
Conclusion
Bollinger Bands are a powerful tool for spotting volatility shifts, trend direction, and potential reversals. However, they work best when combined with other indicators and proper risk management.