23 Jul

In technical analysis, where traders strive to anticipate market movements with precision, pivot points emerge as stalwart indicators. These dynamic reference points, rooted in the calculations of past highs, lows, and closes, play a pivotal role in mapping out potential support and resistance levels.

What is a Pivot?
In essence, the concept of a pivot in technical analysis of financial markets refers to pivotal and significant points that traders or market analysts use to identify price patterns of a stock or asset. Analysts rely on technical analysis tools such as Andrews’ Pitchfork, trendlines, price patterns, and more, to determine these points, which largely indicate price trend changes on charts. Generally, these points represent transitions in price trends from bullish to bearish or vice versa.
Read more: Exponential Moving Average (EMA): A Comprehensive Guide for Traders
Pivots are the turning points of the price of a stock or asset on price charts, where the price direction changes. Pivots also serve as daily benchmarks for stock or asset trading, and unlike fluctuating data and other averages, they remain constant throughout the day.
This means traders can utilize pivots to develop strategies and make well-informed decisions. For instance, a trader may decide to sell a stock or asset if the price drops below the pivot point or buy if the price rises above it during the trading session.
Read More: Top 10 Forex Trading Strategies for Consistent Profits
Types of Pivots
In general, pivots are categorized based on their nature into Price Pivots and Calculated Pivots. Furthermore, based on their reversal strength on charts, they are divided into Minor Pivots and Major Pivots. These categories will be further explored later.
However, before diving into these types, it is important to discuss the various levels associated with pivot points.
Read more: Trading the Inverse Head and Shoulders Pattern: A Comprehensive Guide for Traders
Different Levels of Pivot Points
In total, there are seven distinct levels of pivot points on price charts, described as follows:
- Base Pivot (PP): A primary and central level among other pivot levels.
- Resistance 1 (R1): The first resistance level above the base pivot.
- Resistance 2 (R2): The second resistance level above R1.
- Resistance 3 (R3): The third resistance level above R2.
- Support 1 (S1): The first support level below the base pivot.
- Support 2 (S2): The second support level below S1.
- Support 3 (S3): The third support level below S2.
These levels form the foundation of pivot-based analysis and strategy development in trading.
Read more: What Is Technical Analysis? | Technical Analysis Explained
Calculating Pivot Points: The Mathematics Behind the Magic
The calculation of pivot points involves a straightforward arithmetic process, making them accessible to traders of varying experience levels. The central pivot point (P) is determined by adding the previous day’s high, low, and close prices and dividing the sum by three:
P=(High+Low+Close)/3
Once the central pivot point is established, the support and resistance levels are calculated using specific multiples of the daily trading range. The first support level (S1) and resistance level (R1) are computed by subtracting and adding the daily range to the central pivot point, respectively:
S1=(2×P)−High
R1=(2×P)−Low
Explore more: Advanced Technical Analysis: Using Divergences and Convergences for Precision Trading
The subsequent support and resistance levels (S2, S3, R2, R3) follow similar patterns, incorporating multiples of the daily range into the calculations. This systematic approach ensures that pivot points dynamically adapt to daily price fluctuations, providing traders with relevant and actionable levels.

Types of Pivot Points: Adapting to Trading Styles
As the application of pivot points evolved, various types emerged to cater to different trading styles and market conditions. The three main types are the Classical, Camarilla, and Fibonacci pivot points.
1. Classical Pivot Points:
Classical pivot points follow the standard calculation method described earlier, considering the average of the previous day’s high, low, and close prices. This type serves as the foundation for pivot point analysis and is widely embraced by traders.
Read more: Mastering Ichimoku Cloud Trade; Specialized Topics
2. Camarilla Pivot Points:
The Camarilla pivot point system introduces a more complex set of calculations, incorporating four support and four resistance levels. Designed to emphasize intraday trading, Camarilla pivot points take into account the previous day’s range, providing traders with additional reference points for decision-making.
R4 = C + ((H-L) x 1.5000)
R3 = C + ((H-L) x 1.2500)
R2 = C + ((H-L) x 1.1666)
R1 = C + ((H-L) x 1.0833)
PP = (H + L + C) / 3
S1 = C – ((H-L) x 1.0833)
S2 = C – ((H-L) x 1.1666)
S3 = C – ((H-L) x 1.2500)
S4 = C – ((H-L) x 1.5000)
C – Closing Price, H – High, L – Low

3. Fibonacci Pivot Points:
Drawing inspiration from the Fibonacci sequence, Fibonacci pivot points introduce ratios derived from this mathematical concept into the calculation process. While these levels may not align precisely with the traditional support and resistance points, Fibonacci pivot points offer a unique perspective on potential turning points in the market.
R3 = PP + ((High – Low) x 1.000)
R2 = PP + ((High – Low) x .618)
R1 = PP + ((High – Low) x .382)
PP = (H + L + C) / 3
S1 = PP – ((High – Low) x .382)
S2 = PP – ((High – Low) x .618)
S3 = PP – ((High – Low) x 1.000)
C – Closing Price, H – High, L – Low

Each type of pivot point has its strengths and weaknesses, and traders often experiment with different variants to find the approach that aligns best with their trading style and objectives. Additionally, pivot points can be adapted to various timeframes, from intraday charts to longer-term perspectives, adding to their versatility.
Read More: Resistance Breakout (Breakout) in Technical Analysis
Key Points: Woodie and Demark Pivots
Woodie Pivot
- Focus: Places more weight on the closing price for calculations.
- Use: Determines support and resistance levels based on the pivot point.
- Formulas:
- PP: (High + Low + 2 × Close) / 4
- R1: (2 × PP) – Low
- R2: PP + (High – Low)
- S1: (2 × PP) – High
- S2: PP – (High + Low)
Why It Matters for Traders
- Provides quicker adjustments to price action compared to standard pivots.
- Useful for short-term and intraday strategies.
Demark Pivot
- Focus: Emphasizes recent price changes with dynamic calculations.
- Unique Feature: Uses the relationship between open and close prices to calculate X, a key variable for pivot and levels.
- Formulas:
- If Close > Open: X = (2 × High) + Low + Close
- If Close < Open: X = High + (2 × Low) + Close
- If Close = Open: X = High + Low + (2 × Close)
- Pivot Point: X / 4
- R1: (X / 2) – Low
- S1: (X / 2) – High
Read more: Trading the Head and Shoulders Pattern: A Complete Guide
Why It Matters for Traders
- Excellent for identifying potential breakout points.
- Helps pinpoint dynamic support and resistance levels based on price action trends.
Both pivots are ideal for traders seeking precision and adaptability in their strategies.
Utilizing Pivot Points in Trading: Strategies and Techniques
Now that we’ve unraveled the origins and calculations of pivot points, let’s delve into practical strategies for incorporating these dynamic indicators into your trading toolkit. Pivot points offer a plethora of insights, from identifying potential entry and exit points to managing risk effectively. Here are some key strategies to consider:
1. Pivot Point as a Support/Resistance Zone:
The central pivot point, being the average of the previous day’s price action, often acts as a gravitational center for the market. Traders commonly view this level as a neutral zone; a price above the central pivot suggests a bullish bias, while a price below indicates a bearish bias. The adjacent support and resistance levels then serve as zones where traders anticipate price reactions.
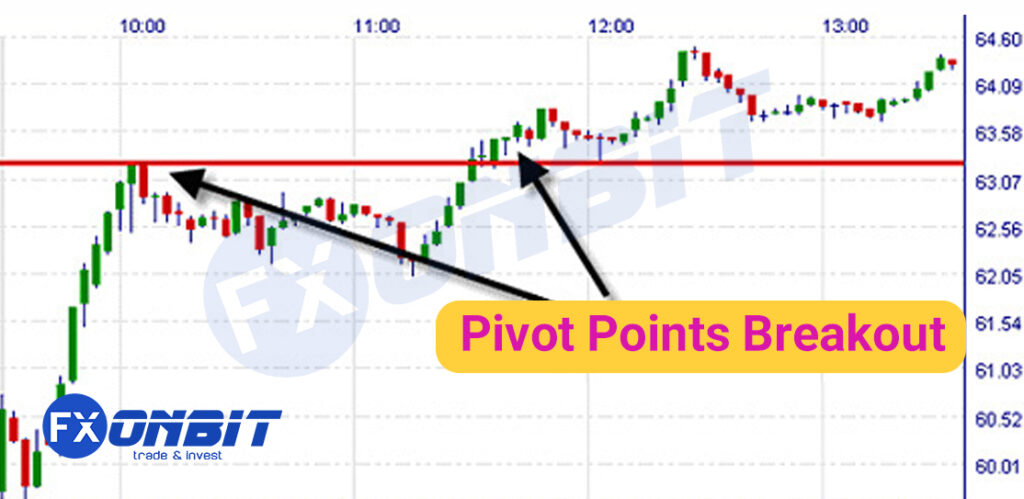
2. Pivot Point Breakout Strategy:
Breakouts from pivot point levels, particularly the central pivot, can signal potential trend changes or continuation. Traders often wait for a decisive move above or below these levels, accompanied by increased volume, to confirm the validity of a breakout. This strategy is particularly effective in trending markets.
3. Pivot Point Bounce:
The pivot point bounce strategy involves entering trades when the price approaches a pivot level and exhibits a bounce or rejection. Traders look for confirmation signals, such as candlestick patterns or trendline alignments, to increase the probability of a successful bounce trade.

4. Multiple Timeframe Analysis:
To enhance the accuracy of pivot point analysis, traders often employ multiple timeframe analysis. Confirming the alignment of pivot points on different timeframes provides a more comprehensive view of potential support and resistance levels, improving the reliability of trading decisions.
5. Combining Pivot Points with Other Indicators:
Pivot points are most effective when used in conjunction with other technical indicators. Combining pivot point analysis with tools like moving averages, RSI, or MACD can offer a more robust framework for decision-making.

Identifying Major and Minor Pivots
Key Points for Differentiating Major and Minor Pivots:
- Major Pivot: Indicates significant trend changes, suitable for detailed technical analysis.
- Minor Pivot: Represents smaller fluctuations within a trend, often less impactful.
Method for Identifying Major Pivots:
To accurately distinguish Major Pivots from Minor Pivots, the following tools and criteria are commonly used:
- Fibonacci Retracement:
- A major pivot often aligns with a price correction of at least 38% of the previous wave.
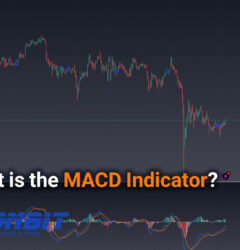
- MACD Indicator:
- A change in the MACD phase (e.g., signal line crossovers) often signals the formation of a major pivot.
Explore more: What is MACD? Full Guidance
Example Application:
- A MACD phase shift occurs when signal lines cross.
- A 38% retracement in Fibonacci confirms a price correction.
- Both conditions must coexist to confirm a major pivot.
Limitations of Pivot Points (PPs) in Technical Analysis
Main Limitations:
- Best for Intraday Trading:
- Pivot Points are primarily effective for daily trading, not ideal for swing or position trades.
- Price Deviation:
- Assets can disregard pivot levels and behave unpredictably.
- No guarantee of price reversal or significant movement around pivot points.
- High Volatility:
- During volatile markets, pivots may fail to provide meaningful signals due to wide price swings.
Practical Approach:
- Use pivot points in combination with other technical tools (e.g., RSI, trendlines) to mitigate limitations and enhance decision-making.
Conclusion: Leveraging Pivot Points for Better Trading
Pivot points are essential tools for understanding market dynamics, reflecting shifts in buying and selling momentum. They are particularly effective for:
- Intraday Trading: Ideal for navigating daily price fluctuations.
- Trend Analysis: Useful for identifying key support and resistance levels.
- Strategy Refinement: Combining pivot points with tools like MACD, Fibonacci, and trendlines enhances accuracy.
Key Takeaways for Traders:
- Experiment with different types (e.g., Woodie, Demark) to find what suits your trading style.
- Use pivot points alongside other indicators to mitigate their limitations in volatile or trending markets.
- Dedicate time to practice and adapt strategies based on market conditions.
Mastering pivot points provides a sharper edge in decision-making and builds a strong foundation for strategic trading success.