24 Dec

Chart patterns are visual representations of price movements on a trading chart that help traders predict future market behavior. By analyzing these patterns, traders can identify potential trend reversals, continuations, or breakout opportunities. Chart patterns are a cornerstone of technical analysis, offering traders a structured way to make decisions based on historical price action rather than emotions or guesswork.
Read more: FXonbit CandleStick Pattern Finder Service: Your Gateway to Smarter Forex and Crypto Trading
Understanding chart patterns is essential for traders who want to maximize their chances of success in the volatile world of Forex, crypto, or stock markets. Let’s dive into the key concepts and essential patterns every trader should know.
Start Our Crypto & Forex Dashboard For Free
Why Are Chart Patterns Important for Traders?
- Predicting Market Movements: Chart patterns provide insights into the likely direction of price movement. This allows traders to anticipate whether a trend will continue or reverse.
- Defining Entry and Exit Points: Patterns highlight critical price levels for entry, stop-loss, and profit targets, helping traders optimize their risk-reward ratios.
- Supporting Risk Management: Recognizing patterns enables traders to avoid high-risk trades and focus on high-probability setups.
- Enhancing Confidence: With a solid understanding of chart patterns, traders can approach the market with more confidence and discipline.
Explore more: What is MACD? Full Guidance
Types of Chart Patterns
Chart patterns can be broadly classified into three categories:
1. Continuation Patterns
These patterns indicate that the current trend is likely to continue.
- Triangles (Ascending, Descending, and Symmetrical): Triangles form when price action consolidates, creating a series of higher lows and lower highs. The breakout direction signals trend continuation.
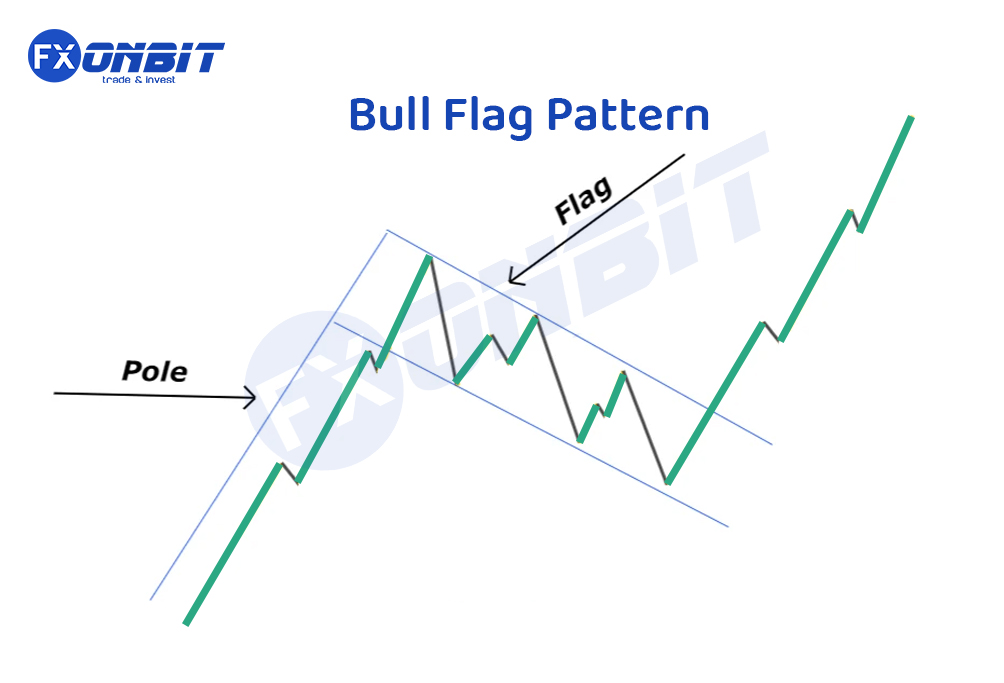
- Flags and Pennants: Flags are small rectangular patterns that slope against the prevailing trend. Pennants resemble small symmetrical triangles. Both suggest a brief consolidation before the trend resumes.
Read more: FXonbit CandleStick Pattern Finder Service: Your Gateway to Smarter Forex and Crypto Trading
2. Reversal Patterns
Reversal patterns signal that the existing trend may reverse direction.
- Head and Shoulders: This pattern comprises three peaks, with the middle peak (head) being the highest. It’s a strong indicator of trend reversal when the neckline is broken.
- Double Tops and Bottoms: These patterns feature two peaks (or troughs) at similar price levels, signaling a reversal once the price breaks key support or resistance levels.
- Rounding Tops and Bottoms: A gradual change in momentum forms these patterns, indicating a long-term trend reversal.
Explore more: What is Crypto Screener? The Best Crypto Screener
3. Neutral Patterns
These patterns do not inherently indicate a specific direction and require confirmation through breakout levels.
- Rectangles: A range-bound pattern where the price moves between parallel support and resistance levels. The breakout direction defines the next trend.
Triple Top Pattern

Triple Bottom Pattern

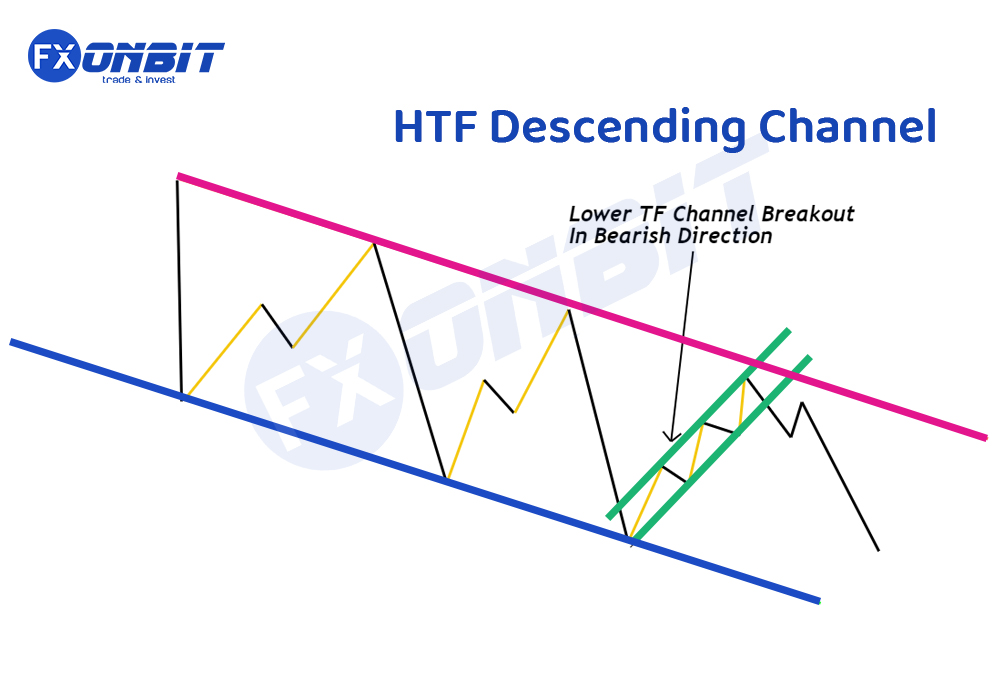
Trend Channel

Rounding Bottom Pattern

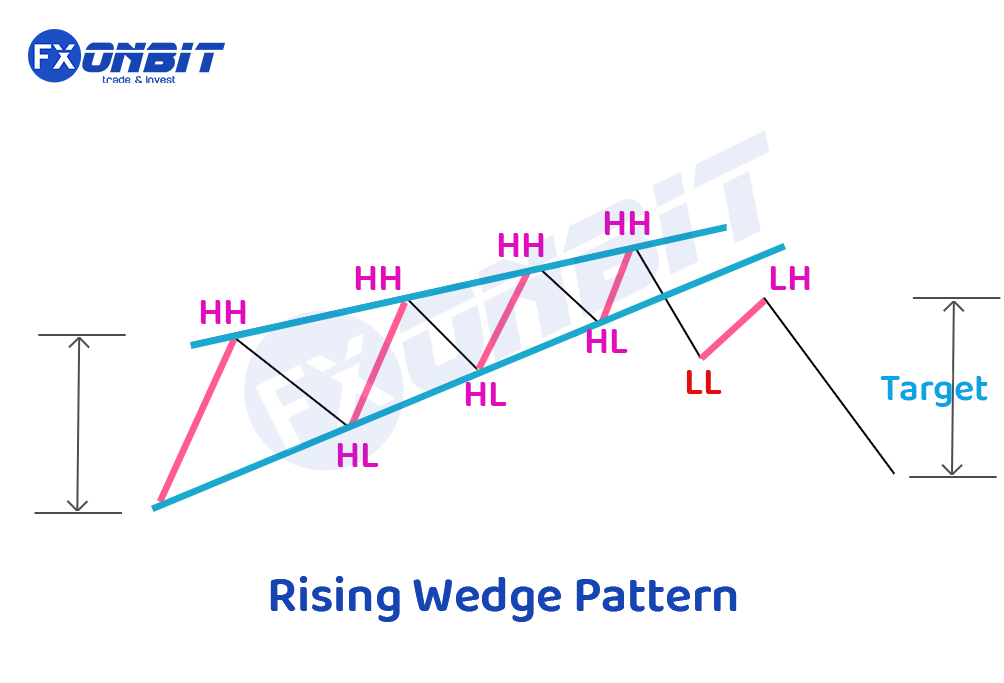
Rising Wedge Pattern
Quasimodo Chart Pattern


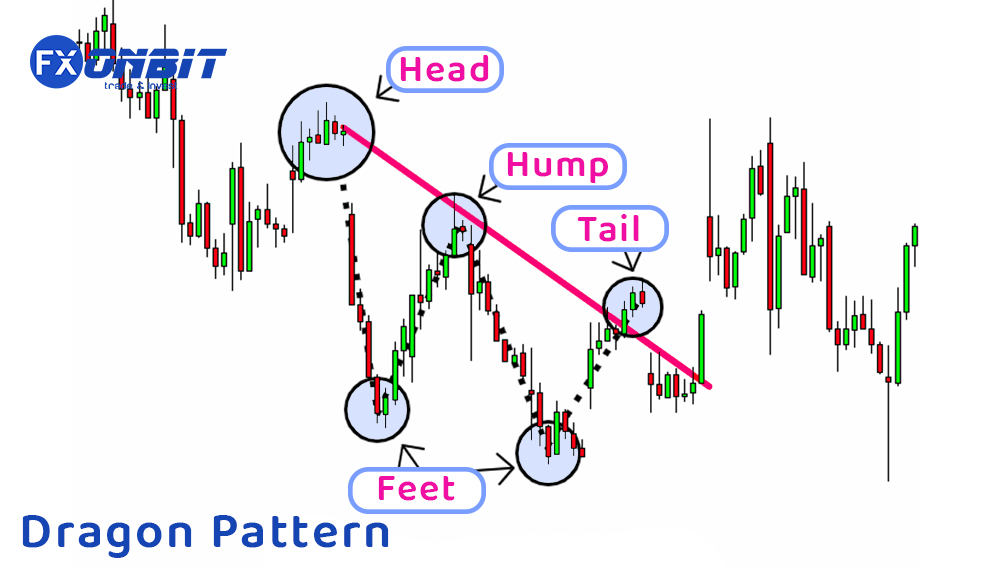
Dragon Pattern
Double Top Pattern

Double Bottom Pattern

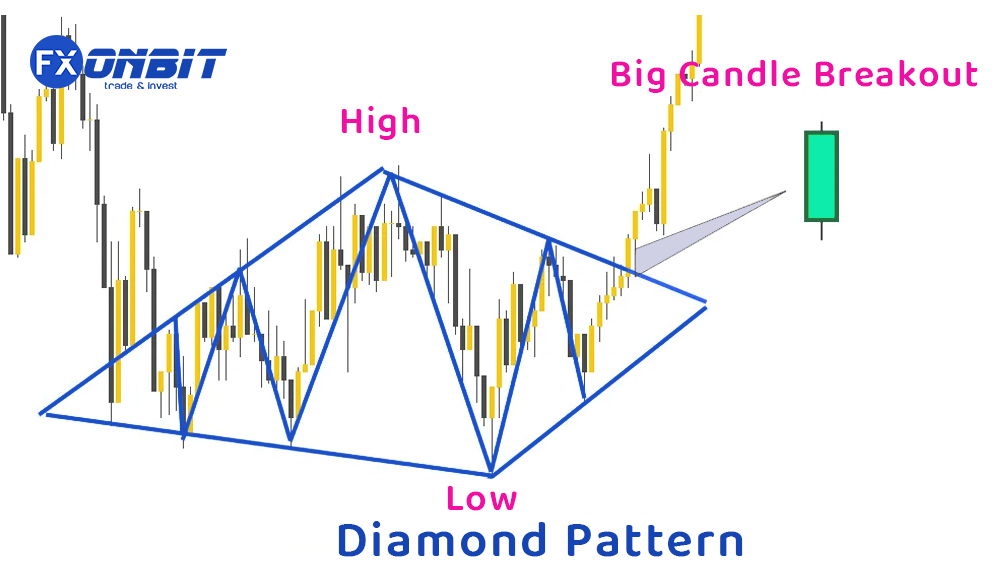
Diamond Pattern


Dead Cat Bounce Pattern

Cup & Handle Pattern


Bull Flag Pattern
Bearish Flag Pattern


Adam and Eve Chart Pattern


Read More: Resistance Breakout (Breakout) in Technical Analysis
How to Use Chart Patterns in Trading
- Identify the Pattern Early: Train yourself to spot emerging patterns early to prepare for potential breakouts or reversals.
- Confirm with Volume: Volume often increases during breakouts or key moments in the pattern. Use this as a secondary confirmation tool.
- Use Indicators for Validation: Combine chart patterns with technical indicators like Moving Averages, RSI, or MACD to strengthen your analysis.
- Set Realistic Targets: Use the pattern’s dimensions to estimate profit targets. For example, the height of a triangle can project the breakout’s potential price movement.
- Implement Risk Management: Always place stop-loss orders below key support levels or above resistance to minimize potential losses.
Read More: Candlestick Patterns: A Comprehensive Guide
Common Mistakes to Avoid
- Ignoring Confirmation: Never act on a pattern without confirming the breakout direction.
- Overtrading Patterns: Not every pattern is a reliable trading opportunity. Be selective and wait for high-probability setups.
- Failing to Adapt: Market conditions can change rapidly. Adapt your strategy if the pattern fails to play out as expected.
- Neglecting Risk Management: Always assess the risk-reward ratio before entering a trade. A solid pattern isn’t a guarantee of success.
Explore more: Top Indicators in Crypto Screeners for Effective Trading
Tips for Beginners Learning Chart Patterns
- Start with Simple Patterns: Focus on mastering basic patterns like triangles and double tops before moving to complex formations.
- Practice with Demo Accounts: Use a demo account to practice identifying and trading patterns without risking real money.
Read more: Crypto Scalp Trading: Basic Guide
Conclusion
Trading chart patterns is an invaluable skill that requires practice, patience, and discipline. By mastering key patterns and incorporating them into a broader trading strategy, traders can make informed decisions and enhance their profitability. Remember, no pattern is foolproof, so always use complementary tools and maintain strict risk management to safeguard your capital. The more you study and trade these patterns, the better you’ll become at navigating the complexities of the financial markets.