07 Jan
On-Balance Volume (OBV) is one of the most effective volume-based indicators in technical analysis, providing traders with valuable insights into buying and selling pressure. Developed by Joe Granville in the 1960s, OBV remains a cornerstone for identifying trends, confirming breakouts, and spotting potential reversals.
In this comprehensive guide, we’ll cover everything from OBV basics to advanced strategies, comparisons with other indicators, and how to leverage it effectively in your trading.
Start Our Crypto & Forex Dashboard For Free
What is On-Balance Volume (OBV)?
OBV is a cumulative indicator that tracks buying and selling pressure by adding or subtracting daily trading volume based on price movements.
- Up-Volume: When a security closes higher than its previous close, all the day’s volume is considered up-volume and is added to the OBV.
- Down-Volume: When the security closes lower, all the day’s volume is subtracted from the OBV.
Explore more: Understanding Volume in Trading: A Beginner’s Guide
The result is a line chart that visualizes the relationship between volume and price, helping traders determine whether volume supports or contradicts price trends.

Related Chart: Ascending Broadening Wedge: A Comprehensive Guide for Traders
How On-Balance Volume Works
OBV operates on a simple yet powerful premise: Volume precedes price movements. When significant volume accompanies price increases or decreases, it often signals the strength of the trend or a potential reversal.
Key Characteristics:
- Rising OBV: Indicates strong buying pressure, often preceding price increases.
- Falling OBV: Suggests selling pressure, which can lead to price declines.
- Flat OBV: Reflects a lack of directional volume pressure, often signaling market indecision or consolidation.
Explore more: How to Use Volume to Confirm Market Trends and Read Market Sentiment
What Does OBV Tell a Trader?
OBV offers traders critical insights into market dynamics:
- Volume Confirmation: Confirms the strength of price trends. A rising OBV validates an uptrend, while a falling OBV confirms a downtrend.
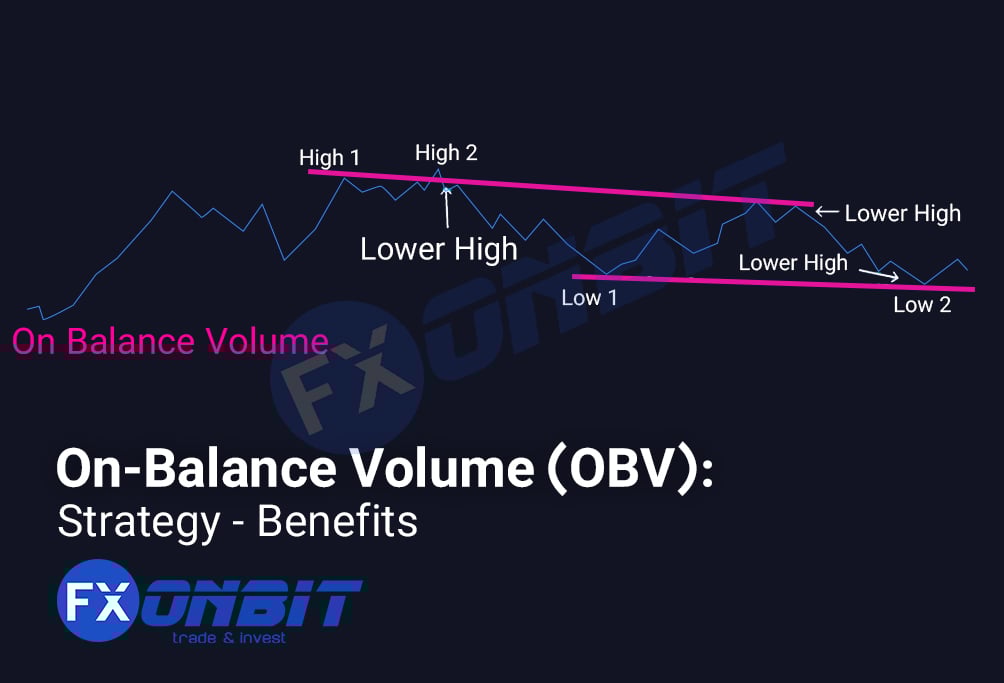
- Divergences: Highlights discrepancies between price and volume, often signaling potential reversals.
- Market Sentiment: Reflects the collective behavior of traders, helping anticipate future price movements.
- Breakout Signals: OBV often breaks key support or resistance levels before prices, acting as a leading indicator.
Explore more: Analyzing Volume Patterns for Breakout & Reversal Signals

Read this Chart Pattern: Bullish Rectangle Pattern: A Trader’s Complete Guide
Strategies for Using OBV in Trading
1. Trend Confirmation
- How to Use: Compare OBV movements with price trends.
- If both OBV and price are rising, it confirms a strong uptrend.
- If OBV diverges from the price trend (e.g., OBV falls while price rises), it signals potential weakness.
- Why It’s Useful: Helps validate trends and avoid false breakouts.
2. Divergence Analysis
- Bullish Divergence: OBV rises while price falls, suggesting accumulation and a potential upward reversal.
- Bearish Divergence: OBV falls while price rises, indicating distribution and a potential downward reversal.
3. OBV and Moving Averages
- How to Use: Apply a moving average (e.g., 20-period) to smooth the OBV line.
- Buy when OBV crosses above the moving average.
- Sell when OBV crosses below the moving average.
- Why It’s Useful: Reduces noise and enhances signal clarity.
4. Support and Resistance Breakouts
- How to Use: Monitor OBV for breakouts above resistance or below support levels.
- Why It’s Useful: Provides early signals of price breakouts, allowing traders to enter positions ahead of the crowd.
Find Out More: What is Crypto Automation? Enhancing Trading Precision in the Digital Era

Key Benefits of Using OBV
- Easy to Interpret: Its visual simplicity makes it accessible to traders of all levels.
- Real-Time Market Sentiment: Reflects the cumulative buying and selling pressure, providing actionable insights.
- Versatile Applications: Works across multiple timeframes and asset classes, including stocks, forex, and cryptocurrencies.
- Complementary Indicator: Pairs well with other tools like RSI, moving averages, and VWAP for comprehensive analysis.
Explore more: Filtering High-Volume Cryptos: Guide to Finding Liquidity with Screeners
Volume indicators play a crucial role in technical analysis, helping traders understand the relationship between price movements and market activity. While On-Balance Volume (OBV) is a powerful tool, other volume indicators like the Accumulation/Distribution (A/D) Indicator, Volume-Price Trend (VPT), and Relative Strength Index (RSI) offer complementary perspectives. Here’s a deeper dive into these comparisons to help traders choose the right tools for their strategies.
Read more related: Drawdown and Maximum Drawdown in Forex
OBV vs. Accumulation/Distribution (A/D) Indicator
How They Work:
- OBV:
- Adds or subtracts the entire day’s volume based solely on whether the closing price is higher or lower than the previous day.
- Focuses on broad directional flow of volume, making it ideal for tracking overall trends in buying and selling pressure.
- A/D Indicator:
- Weighs volume based on the position of the closing price within the day’s high-low range. For example, if the price closes near the high, more of the day’s volume is considered buying pressure, and vice versa.
- Offers a more nuanced view of volume distribution, reflecting intraday sentiment.
Which to Use:
- Use OBV for identifying broader, longer-term trends, as it captures cumulative buying and selling pressure without getting bogged down by intraday noise.
- Use A/D Indicator for detailed, intraday analysis where understanding the precise distribution of volume within a session is critical. For example, A/D is helpful for scalping or short-term trading strategies.
Read more: Crypto Scalp Trading: Basic Guide
Example:
- If a stock has high volume but closes near the session’s low, the A/D Indicator will reflect this as bearish activity, while OBV may still record the volume as bullish if the close is above the previous day’s close. This contrast highlights A/D’s focus on granular details versus OBV’s emphasis on broader trends.
Read more: What is advantages of FXonbit’s Forex Screener?
OBV vs. Volume-Price Trend (VPT)
How They Work:
- OBV:
- Tracks volume changes without considering the magnitude of price changes. It only takes into account whether the price closed higher or lower.
- Ideal for observing large-scale accumulation or distribution trends.
- VPT:
- Adjusts volume based on the percentage change in price. If the price rises significantly, more weight is given to the volume, and vice versa.
- Offers a more sensitive measure that reflects how strongly volume supports price changes.
Which to Use:
- Use OBV for identifying long-term trends, where cumulative volume over time is more important than the specifics of daily price movements.
- Use VPT for spotting nuanced relationships between price and volume. For example, VPT is useful for traders seeking to understand whether sharp price changes are supported by sufficient volume.
Example:
- A stock with a small price increase and high volume may show a significant change in OBV, but only a modest change in VPT because the price movement was minimal. Conversely, a sharp price move on moderate volume might barely affect OBV but would cause a noticeable change in VPT.
Explore more: How to Combine Technical Indicators for More Accurate Trade Signals
OBV vs. RSI (Relative Strength Index)
How They Work:
- OBV:
- Focuses on volume momentum, helping traders identify whether buying or selling pressure is dominant.
- Often used to confirm price trends and spot divergences.
- RSI:
- Measures price momentum and identifies overbought or oversold conditions by comparing recent gains to recent losses.
- Indicates when a price move may be due for a reversal, based purely on price dynamics.
Which to Use:
- Use OBV for understanding the underlying strength of a price trend, as it provides insights into whether volume is supporting the movement.
- Use RSI for timing entry and exit points, especially in overbought or oversold conditions.
- Combine OBV and RSI for a holistic view. For example:
- If RSI shows oversold conditions and OBV indicates rising buying pressure, it strengthens the case for a bullish reversal.
- If RSI indicates overbought conditions and OBV shows falling volume, it suggests the uptrend may be losing strength.
Example:
- A stock in a strong uptrend might show an overbought RSI, suggesting caution. However, if OBV continues to rise, it indicates that the trend is supported by strong buying pressure, and the uptrend may still have room to run.

Chart Pattern: Bump and Run Pattern: A Comprehensive Guide
OBV vs. VWAP (Volume-Weighted Average Price)
How They Work:
- On-Balance Volume (OBV):
- Tracks cumulative volume flow, adding or subtracting volume based on whether the price closes higher or lower than the previous day.
- Focuses on the relationship between price direction and volume, helping traders confirm trends or spot divergences.
- Volume-Weighted Average Price (VWAP):
- Represents the average price of a security, weighted by volume throughout the trading session.
- Provides a benchmark for intraday prices, showing whether the asset is trading above or below its fair value.
Which to Use:
- OBV: Best for analyzing long-term trends and understanding whether volume supports the broader price movement.
- VWAP: Ideal for intraday trading to identify fair value levels and assess whether the current price offers a favorable entry or exit.
Example:
- A stock trading above VWAP may indicate strong intraday buying momentum, signaling a good entry point for day traders. Meanwhile, if OBV is rising, it suggests that cumulative buying pressure supports the uptrend, making it a more reliable long-term investment opportunity.
Use Together:
- Combine OBV with VWAP to align intraday and long-term strategies. For instance, enter a trade when the price is above VWAP (bullish intraday) and OBV is rising (bullish longer-term trend).
Read more: What is Forex Screener? Free Trading Opportunities with a Comprehensive Tool
Is OBV Leading or Lagging?
OBV is unique in its ability to act as both a leading and lagging indicator, depending on the market conditions and how it’s applied.
Leading Indicator:
- How It Leads: Divergences between OBV and price often signal potential trend reversals.
- Bullish Divergence: OBV rises while price declines, indicating accumulation and a possible upward reversal.
- Bearish Divergence: OBV falls while price rises, signaling distribution and a potential downward reversal.
- Why It’s Useful: Traders can anticipate price changes before they occur, entering positions early to maximize gains or minimize losses.
Lagging Indicator:
- How It Lags: Confirms the strength of established trends by showing whether volume supports the price movement.
- Rising OBV during an uptrend validates strong buying pressure.
- Falling OBV during a downtrend confirms sustained selling pressure.
- Why It’s Useful: Helps traders confirm the validity of a trend, reducing the risk of acting on false breakouts or breakdowns.
Example:
- If a stock is in an uptrend and OBV diverges by falling, it acts as a leading signal of potential weakness. Conversely, if OBV rises alongside price, it confirms the trend and acts as a lagging indicator.
Read Related: What Is Forex Risk Management?
OBV and Average Daily Trading Volume (ADTV)
What is ADTV?
Average Daily Trading Volume (ADTV) represents the average number of shares traded in a day over a specific period (e.g., 20 or 50 days). It provides context for evaluating the current day’s volume relative to historical norms.
How OBV and ADTV Work Together:
- Deviations from ADTV:
- If daily volume significantly exceeds ADTV and OBV rises, it signals strong buying pressure and potential bullish momentum.
- If volume exceeds ADTV but OBV falls, it indicates strong selling pressure and bearish sentiment.
- Low Volume Days:
- When daily volume is below ADTV and OBV is flat, it suggests a lack of conviction in the market, likely leading to sideways price action.
- Spotting Unusual Activity:
- Pairing OBV with ADTV helps identify anomalies in volume, which may signal accumulation, distribution, or manipulation before price changes become evident.
Example:
- A stock’s ADTV is 1 million shares. If volume spikes to 5 million shares and OBV rises, it indicates aggressive buying and suggests a continuation of the uptrend. Conversely, if OBV falls on high volume, it’s a red flag for potential selling pressure.
OBV and Support/Resistance Levels
How OBV Interacts with Support and Resistance:
- Support Levels:
- If OBV bounces at a support level and starts rising, it signals strong buying activity, reinforcing the support zone.
- A break below support on declining OBV indicates weak demand, increasing the likelihood of further price declines.
- Resistance Levels:
- If OBV rises and breaks above a resistance level, it suggests strong buying momentum, increasing the likelihood of a price breakout.
- Conversely, if OBV fails to break resistance and begins to fall, it indicates weak buying pressure and a potential reversal.
Why It’s Effective:
OBV often breaks key support or resistance levels before price does, acting as a leading indicator for breakouts or breakdowns. Traders can use this behavior to anticipate price movements and adjust their positions early.
Example:
- A stock consolidates below a resistance level at $100. While the price remains flat, OBV rises steadily, signaling accumulation. This suggests an imminent breakout above $100, giving traders a head start to enter the position.
Practical Strategy:
Monitor OBV for a breakout above resistance or a breakdown below support. Enter trades in the direction of OBV’s movement, and use the levels to set stop-loss or take-profit points.
Conclusion
On-Balance Volume (OBV) is a versatile and powerful tool for traders looking to incorporate volume analysis into their strategies. By identifying trends, spotting divergences, and confirming breakouts, OBV provides a wealth of actionable insights for traders across all markets and timeframes.
When combined with complementary indicators and a disciplined trading plan, OBV can significantly enhance decision-making and improve trading performance. Whether you’re a novice or a seasoned professional, mastering OBV is an essential step toward success in today’s dynamic markets.
Hi, I’m Asena, a Senior Marketing Specialist with over 8 years of experience and a deep passion for trading knowledge. I have a genuine fascination with the world of Crypto and Forex markets. Over the past 6 years, I’ve dedicated myself to writing about technical analysis, fundamental analysis, and the intricate dynamics of these markets. My mission is to provide the most complete and comprehensive data to empower my audience with actionable insights. I truly love what I do and constantly strive to deliver the best possible results for my readers and users.

Asena Taremi