23 Jan
How to Find Breakouts by Crypto Screener? Breakout trading is one of the most effective strategies for capitalizing on significant price movements in the cryptocurrency market. A breakout occurs when an asset’s price moves beyond a defined support or resistance level, often followed by increased momentum and trading volume. By using a crypto screener, traders can efficiently identify breakout opportunities and maximize their profits.
This guide will walk you through how to effectively use a crypto screener to spot breakouts and make better trading decisions.

What Is a Breakout?
A breakout signals the start of a new trend or the continuation of an existing one.
These are the key factors to look for:
- Resistance Level Breakouts: When the price surpasses a ceiling it struggled to break.
- Support Level Breakouts: When the price drops below a floor it previously held.
- Volume Confirmation: A valid breakout is often accompanied by high trading volume.
- Volatility Spike: Breakouts typically occur in highly volatile market conditions.
Explore more: Resistance Breakout (Breakout) in Technical Analysis
How to Screen for Breakouts Effectively
Breakouts occur when the price of a cryptocurrency moves decisively beyond a defined support or resistance level, typically accompanied by increased volume and volatility. Here’s how to fine-tune your approach to screening for breakouts:
Explore more: Filtering High-Volume Cryptos: Guide to Finding Liquidity with Screeners
Step 1: Set Up Price and Volume Filters
Your screener can save you a lot of time by filtering assets based on specific parameters. Here’s a deeper dive into how to configure these filters:
- Price Thresholds:
- Look for coins trading near their 7-day or 30-day highs or lows. This indicates they are testing key levels.
- Example: If a coin’s 30-day high is $100, set your filter for prices trading between $95 and $100.
- Volume Spikes:
- Identify coins with trading volumes that have increased significantly compared to the previous day (e.g., 50% or more).
- Why this matters: Breakouts are often accompanied by a surge in trading activity as traders pile in.
- Volatility Levels:
- Use the Average True Range (ATR) to identify coins with higher-than-average price movements.
- Example: A coin with an ATR twice its 14-day average is likely experiencing increased volatility—a potential breakout signal.
Read more: Ichimoku Cloud Trading Strategies for Beginners
Pro Tip: Use screener presets like “Top Gainers,” “High Volume Movers,” or “Near Highs/Lows” for quick access to promising assets.
What do it mean?
Leveraging pre-configured screener presets in crypto screeners. These presets are pre-designed filters or categories available in screeners that allow you to quickly identify assets with specific characteristics like FXonbit crypto screener. Here’s a breakdown of what each preset means:
1. Top Gainers
- What it shows: Assets with the highest price increase (percentage-wise) over a specific time frame (e.g., the last 24 hours or day).
- Why it matters:
- Indicates strong momentum or news driving the price up.
- Often useful for identifying breakouts or short-term bullish trends.
- Example: If a coin has gained 20% in the last 24 hours, it will likely appear in this category.
Use Case: A trader looking for potential continuation in strong trends can focus on these assets to analyze further.
Explore more: Crypto Whale Tracker Guide: How to Follow the Biggest Players in the Market
2. High Volume Movers
- What it shows: Assets experiencing a significant surge in trading volume compared to their average volume.
- Why it matters:
- High volume often signals increased trader interest, which could be due to major news, partnerships, or breakout opportunities.
- Volume is a key indicator of a strong price move’s validity.
- Example: A coin with a daily trading volume that’s 3x its 30-day average volume might signal heavy buying or selling activity.
Use Case: Traders can filter out low-volume assets (which may be illiquid or manipulated) and focus on coins with meaningful activity.
3. Near Highs/Lows
- What it shows: Assets trading close to their recent highs or lows (e.g., 30-day high/low, 52-week high/low).
- Why it matters:
- Near Highs: Indicates bullish momentum, as the asset is approaching or testing resistance levels. This can be a potential breakout opportunity.
- Near Lows: Highlights assets nearing support levels, which could indicate either potential reversal (bullish) or breakdown (bearish).
- Example: A coin trading 1% below its 30-day high could signal a potential breakout if it breaches the resistance.
Read more: What is Crypto Whale Tracker? How FXonbit Empowers You to Follow Market Giants
Use Case: Traders can prepare strategies for both breakout opportunities (near highs) or reversal plays (near lows).
Why Use These Presets?
- Efficiency: Instead of manually setting filters every time, these presets give you a quick snapshot of promising assets, saving time during analysis.
- Focus: They guide you to assets already showing significant activity or nearing critical levels, increasing the chances of finding actionable trades.
- Customizable: Many screeners let you adjust these presets. For example, in a “High Volume Movers” preset, you can set thresholds like “volume increase above 50%.”
Example Workflow:
Let’s say you’re short on time but want to find breakout opportunities:
- Open your crypto screener.
- Select the “Top Gainers” preset.
- Sort results by volume to filter out low-volume assets.
- Look for coins also near their highs.
- Add a secondary filter like “RSI above 70” to ensure momentum.
Read more: Advanced Ichimoku Cloud Trading Strategies
Step 2: Use Technical Indicators
Technical indicators help you validate the likelihood of a breakout. Here’s how to use them:
- Bollinger Bands:
- Breakouts occur when prices move beyond the upper band (bullish breakout) or below the lower band (bearish breakout).
- Look for bands that are “squeezing” or narrowing, which often precedes a strong breakout.

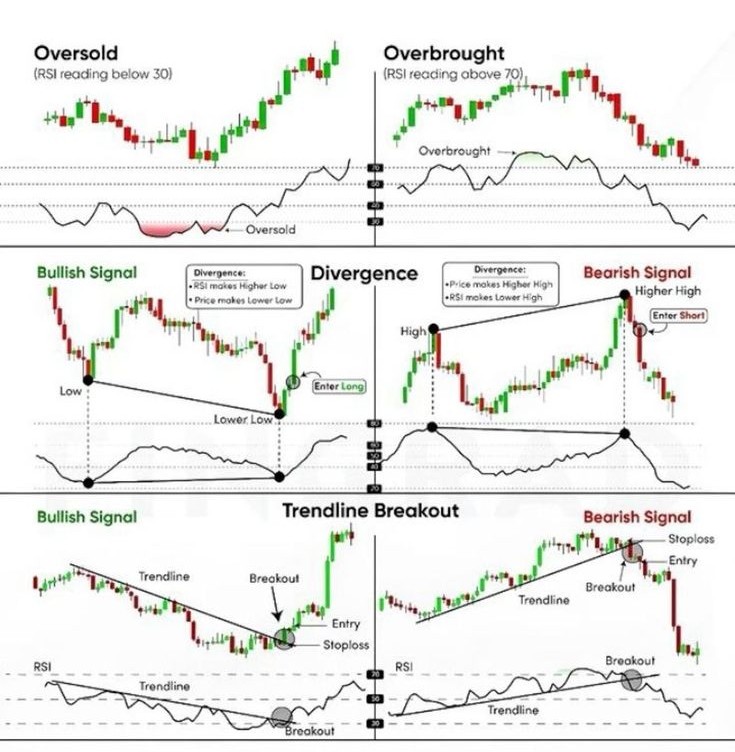
- Relative Strength Index (RSI):
- RSI above 70 indicates an overbought condition, which might lead to a reversal or continuation of a bullish breakout.
- RSI below 30 indicates an oversold condition, signaling a potential bearish breakout.
Read more: Best Crypto Screener for Trading
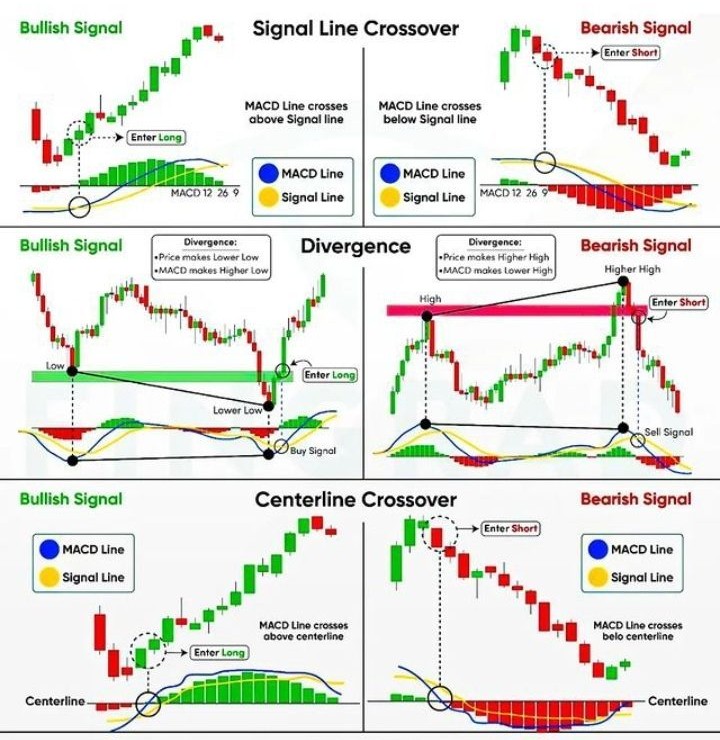
- MACD (Moving Average Convergence Divergence):
- A bullish breakout is confirmed when the MACD line crosses above the signal line, especially when it’s accompanied by increasing volume.
- A bearish breakout is indicated when the MACD line crosses below the signal line.
Explore more: What is MACD? Full Guidance
Pro Tip: Combine multiple indicators for confirmation. For instance, if RSI is over 70 and the price breaks the upper Bollinger Band with high volume, the breakout is more likely to be reliable.
Explore more: Top Indicators in Crypto Screeners for Effective Trading
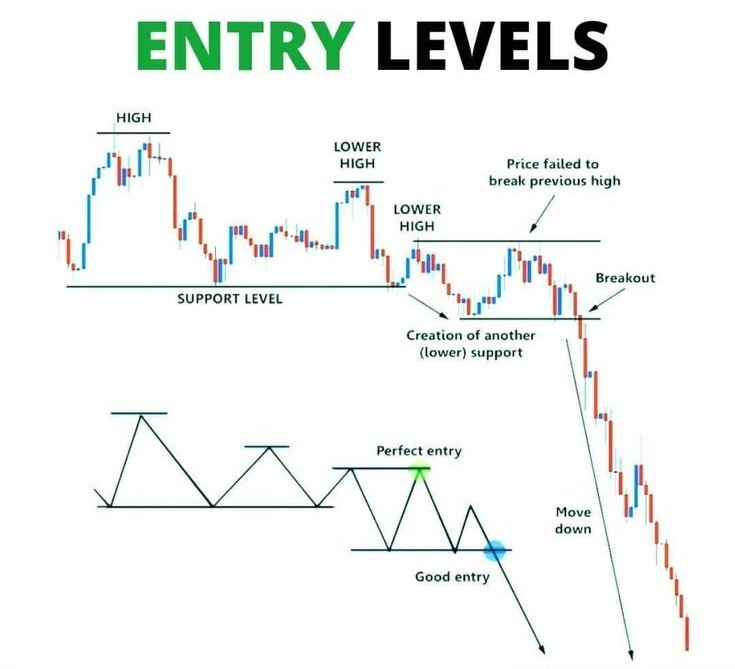
Step 3: Identify Key Support and Resistance Levels
Support and resistance levels act as psychological barriers for price movements:
- How to Identify Levels:
- Use horizontal lines to mark areas where the price has historically reversed or stalled (e.g., previous highs and lows).
- Use Fibonacci retracement tools to identify potential support and resistance levels.
- Confirm the Breakout:
- A breakout above resistance indicates bullish momentum and the possibility of new highs.
- A breakout below support suggests bearish momentum and potential price declines.
- Screening for Levels:
- Set your screener to highlight coins trading within 1-2% of their key support or resistance levels.
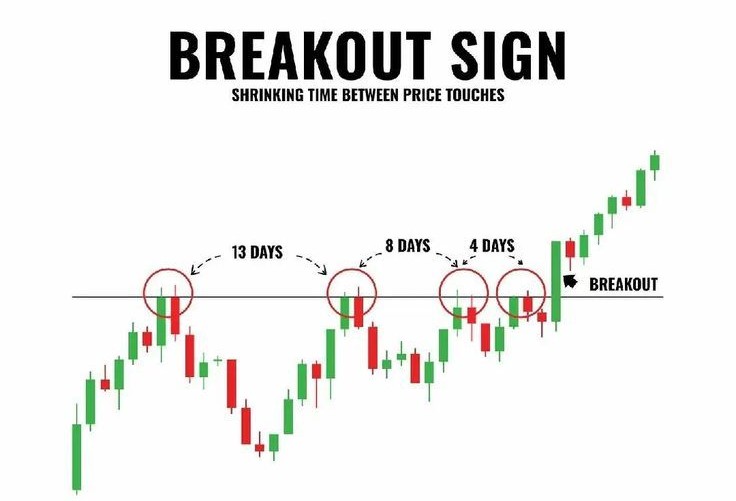
Pro Tip: Pay attention to false breakouts, where prices briefly cross a level but fail to hold. Confirm the breakout by watching for sustained movement above/below the level across multiple timeframes.
Read more: Maximize Your Crypto Profits with a Crypto Screener
Step 4: Configure Alerts To Find Breakouts by Crypto Screener
Alerts are your best tool for reacting quickly to breakout opportunities. Here’s what to set up:
- Price Alerts:
- Notify you when the price crosses above a resistance level or below a support level.
- Volume Alerts:
- Triggered by sudden spikes in trading volume (e.g., 50% above the average).
- Indicator-Based Alerts:
- Set alerts for key technical indicator events like RSI crossing 70/30 or a MACD crossover.
Pro Tip: Some screeners allow you to send alerts via email, or push notifications. Use this feature to stay updated in real time.
Read more: FXonbit CandleStick Pattern Finder Service: Your Gateway to Smarter Forex and Crypto Trading
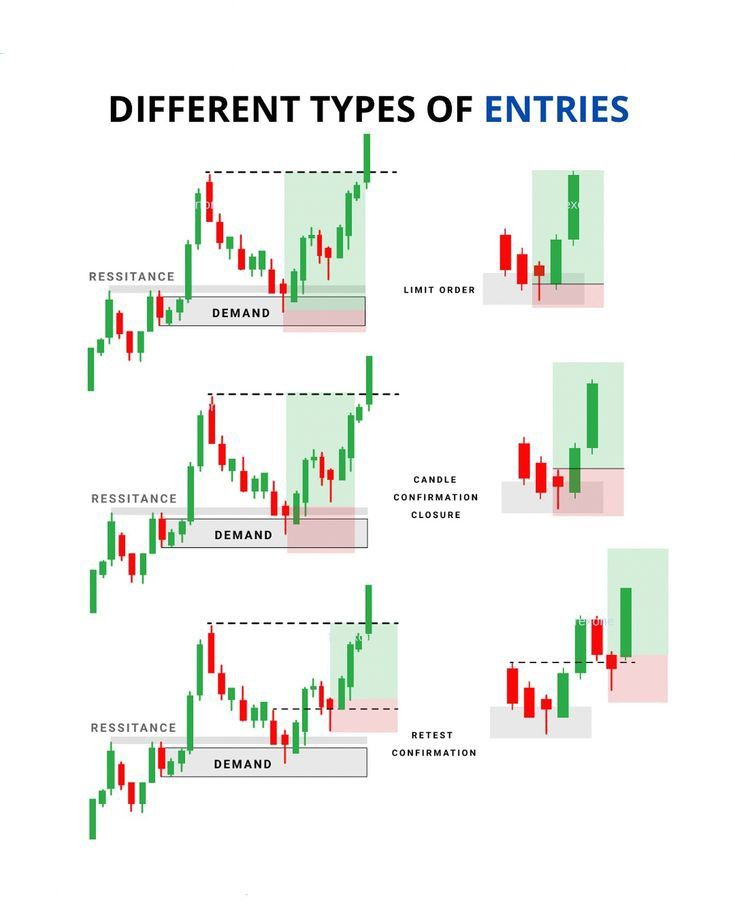
Step 5: Validate the Breakout
Before making a trade, confirm that the breakout is genuine. Here’s how to validate it:
- Check Multiple Timeframes:
- Use shorter timeframes (e.g., 15-minute, 1-hour) to spot the breakout.
- Use longer timeframes (e.g., 4-hour, daily) to confirm its sustainability.
- Volume Confirmation:
- A true breakout is accompanied by a significant increase in trading volume. Low volume may signal a false breakout.
- Indicator Confirmation:
- Combine multiple indicators like Bollinger Bands, RSI, and MACD to confirm the trend.
- Example: If a coin breaks above resistance with a strong RSI and a bullish MACD crossover, it’s a good breakout candidate.
- Post-Breakout Behavior:
- Wait to see if the price retests the breakout level and holds. This retest often provides a safer entry point.
Find Out More: What is Crypto Automation? Enhancing Trading Precision in the Digital Era

Example Find Breakouts by Crypto Screener More Detail:
1. Filters Applied:
- Coins Trading Within 1% of Their 30-Day High:
This filter identifies coins that are near their 30-day high, suggesting strong upward momentum and potential for a breakout. The reasoning is that when a coin reaches such levels, it’s either due to strong buying interest or significant positive sentiment in the market. - 75% Increase in Daily Volume:
An increase in volume is a key indicator of market activity and trader interest. A 75% increase in daily volume compared to the average indicates that a breakout is supported by strong participation, reducing the likelihood of false signals.
Take Our Poll! What Features Do You Want in a Crypto Screener? Share Your Input!
2. Technical Analysis:
- Bollinger Bands:
Bollinger Bands consist of a middle band (simple moving average) and two outer bands representing standard deviations. When the price breaks above the upper Bollinger Band, it signals strong upward momentum.- Why this matters: Breaking above the upper band typically indicates increased volatility and a strong bullish move.
- RSI Above 70:
The Relative Strength Index (RSI) measures the speed and change of price movements. When RSI crosses above 70, it often suggests the asset is overbought, but in the case of a breakout, it confirms bullish strength.- Confirmation: This ensures the breakout isn’t just noise but backed by momentum.
Explore more: How to Combine Technical Indicators for More Accurate Trade Signals
3. Action:
- Entering the Position:
The trader enters a long (buy) position as soon as the price breaks above the resistance level (the 30-day high).- Why now: Breakouts often lead to rapid price movements, so entering at the right moment is crucial to maximize gains.
- Setting a Stop-Loss:
The stop-loss is set just below the breakout level, ensuring that if the price reverses and falls back below resistance, losses are minimized.- Risk Management: This prevents significant losses in case the breakout fails.
Read more: How to Analyze Altcoins Effectively Using a Crypto Screener
Read more: Price Action Trading: The Art of Trading Without Indicators
4. Why Use These Filters?
Filters like the 30-day high and volume increase narrow down the list of coins, helping traders focus on those with the highest potential. They reduce noise and ensure the trader doesn’t waste time analyzing assets with weak breakout potential.
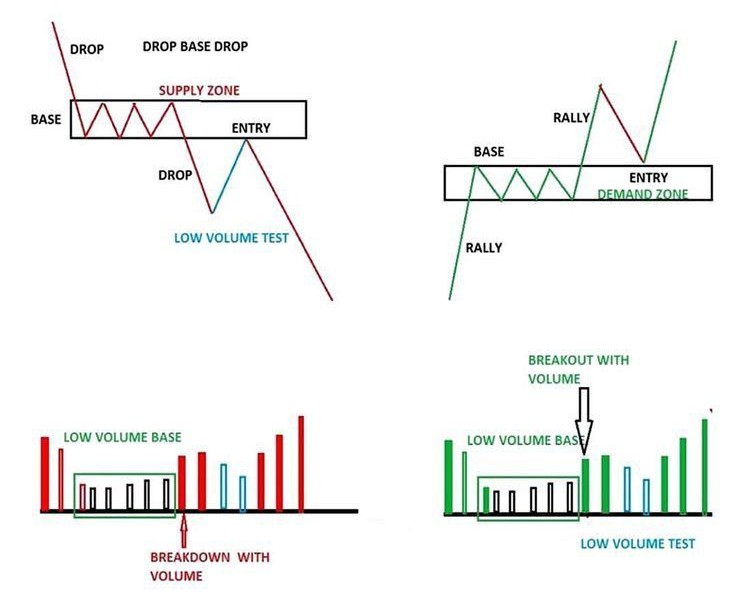
5. The Importance of Volume in Breakouts:
Volume acts as a confirmation signal. If the breakout occurs with low volume, it might be a false breakout or manipulation. However, when a breakout is accompanied by a significant increase in volume, it shows that many traders are participating, validating the move.
6. Risk-to-Reward Ratio:
Before entering the trade, the trader assesses the risk-to-reward ratio.
- Risk: The distance between the entry point and stop-loss level.
- Reward: The potential upside, based on price targets or historical resistance levels.
For example, if the risk is 1% of the trade value and the potential reward is 3%, the risk-to-reward ratio is 1:3, which is favorable.
Read more: Weighted Moving Average (WMA): A Comprehensive Guide for Traders
7. Monitoring After Entry:
After entering the trade, the trader continues to monitor key indicators:
- RSI: If it crosses back below 70, it might indicate weakening momentum.
- Volume: Sustained volume is critical. A sudden drop in volume might signal the breakout is losing strength.
- Price Movement: Use trailing stops to lock in profits as the price continues to move up.
8. Alternative Strategies in Case of False Breakouts:
False breakouts happen when the price briefly breaks above resistance and then falls back. To mitigate this risk:
- Wait for a pullback to the breakout level after the initial surge. If the price holds above this level, it confirms the breakout.
- Use additional indicators like MACD to confirm bullish momentum.
Example Trade Breakdown:
- Filters Return Coin A:
- Coin A is trading at $50, which is 0.8% below its 30-day high of $50.40.
- Daily trading volume increased by 80% compared to the 14-day average.
- Technical Indicators:
- Bollinger Bands: The price broke above the upper band at $50.20.
- RSI: At 72, confirming bullish momentum.
- Trade Execution:
- Entry Price: $50.25
- Stop-Loss: $49.80 (just below the breakout level)
- Target Price: $52.50 (based on previous resistance or psychological levels).
- Risk-to-Reward Ratio: 1:5 ($0.45 risk for $2.25 reward).
- Post-Trade Monitoring:
- Price steadily increases to $52.50.
- Trailing stop-loss adjusted to $51 to lock in profits.
- Trade closed at $52.50 for a 4.5% profit.
Tips for Effective Breakout Trading
Breakout trading can be incredibly rewarding, but it requires discipline and a clear strategy to avoid common pitfalls. Here’s how to refine your approach:
1. Avoid False Breakouts
False breakouts happen when the price temporarily crosses a support or resistance level but fails to hold and reverses direction. To minimize the risk of false breakouts:
- Validate with Volume:
- Genuine breakouts are usually accompanied by a significant increase in trading volume. If volume is low, the breakout may lack strength.
- Look for at least a 50% increase in volume compared to the asset’s daily average.
- Check Multiple Timeframes:
- Use smaller timeframes (e.g., 15-minute or 1-hour) to spot the breakout and larger timeframes (e.g., 4-hour or daily) to confirm its validity.
- A breakout that holds across multiple timeframes is more likely to be genuine.
- Monitor Retests:
- After a breakout, the price often retests the broken support or resistance level. If the level holds during the retest, it’s a stronger signal of a valid breakout.
Pro Tip: Beware of “breakout traps” during low-liquidity periods (e.g., weekends or off-peak hours) when price movements can be deceptive.
2. Use Stop-Loss Orders
A well-placed stop-loss protects your capital by limiting losses if the trade moves against you. Here’s how to set effective stop-losses:
- For Bullish Breakouts:
- Place your stop-loss slightly below the resistance level that was broken.
- Example: If resistance was at $100 and the price breaks out to $105, set your stop-loss at $98–$99.
- For Bearish Breakouts:
- Place your stop-loss slightly above the support level that was broken.
- Example: If support was at $50 and the price breaks down to $45, set your stop-loss at $52–$53.
- Adjust for Volatility:
- Use the Average True Range (ATR) to determine the ideal stop-loss distance. A volatile asset requires a wider stop-loss, while a less volatile asset can use a tighter one.
Pro Tip: Use trailing stop-loss orders to lock in profits as the price moves in your favor.
Learn more about Trading Plan and what is it?
3. Refine Your Screener Settings
A good screener can be your best ally in breakout trading, but it requires regular tweaking. Here’s how to refine your filters:
- Test Historical Performance:
- Backtest your screener settings using historical data to see how well they identify past breakouts.
- Adjust your filters based on the success rate of previous setups.
- Experiment with Indicators:
- Try different combinations of technical indicators (e.g., Bollinger Bands, RSI, MACD) to see which provides the most reliable signals for your trading style.
- Adjust Volume and Price Filters:
- Increase or decrease your volume spike threshold based on the asset class or market conditions.
- Example: During a bull market, reduce the threshold slightly to capture more breakout opportunities.
- Monitor Market Conditions:
- In volatile markets, increase your focus on ATR or Bollinger Band squeezes.
- In consolidating markets, pay more attention to assets nearing long-term support/resistance levels.
Pro Tip: Save multiple screener presets for different market conditions (e.g., trending vs. ranging markets).
Additional Strategies for Breakout Success
- Trade with the Trend:
- Breakouts in the direction of the prevailing trend are more likely to succeed.
- Use trend-following indicators like moving averages to confirm the trend direction.
- Don’t Overleverage:
- Using excessive leverage increases risk during false breakouts. Always trade within your risk tolerance.
- Stay Patient:
- Not every breakout will lead to a sustained trend. Wait for confirmation signals before entering a trade.
- Review Your Trades:
- After each trade, analyze what worked and what didn’t. Look for patterns in successful trades to refine your strategy further.
Read Related: 40 Powerful Candlestick Patterns in Forex & Crypto

Why FXonbit’s Crypto Screener Is the Best Tool for Breakouts
At FXonbit, we’ve designed an advanced crypto screener to help traders identify breakout opportunities with precision. Here’s why it stands out:
- Comprehensive Filters: Filter by price, volume, and volatility effortlessly.
- Advanced Indicators: Access RSI, MACD, Bollinger Bands, and more.
- Custom Alerts: Get real-time notifications for breakout conditions.
- User-Friendly Interface: Simplify complex analyses with intuitive tools.
- Real-Time Data: Stay ahead of the market with up-to-the-minute updates.
With FXonbit’s advanced screener, spotting and acting on breakout opportunities has never been easier. Visit FXonbit.com to experience smarter trading today!
Breakout trading is a proven strategy for success in the crypto market. By using a crypto screener effectively and combining it with sound technical analysis, you can maximize your trading potential. With tools like FXonbit’s Advanced Crypto Screener, you’ll have everything you need to identify and capitalize on breakout opportunities.
Hi, I’m Asena, a Senior Marketing Specialist with over 8 years of experience and a deep passion for trading knowledge. I have a genuine fascination with the world of Crypto and Forex markets. Over the past 6 years, I’ve dedicated myself to writing about technical analysis, fundamental analysis, and the intricate dynamics of these markets. My mission is to provide the most complete and comprehensive data to empower my audience with actionable insights. I truly love what I do and constantly strive to deliver the best possible results for my readers and users.


Asena Taremi