24 Jan

The Ichimoku Cloud Trading indicator provides a wide range of trading strategies, even for beginners. Two of the most common are Tenkan-sen and Kijun-sen crossovers and Cloud breakout strategies.
Start Our Crypto Screener Dashboard
Using Tenkan-sen and Kijun-sen Crossovers
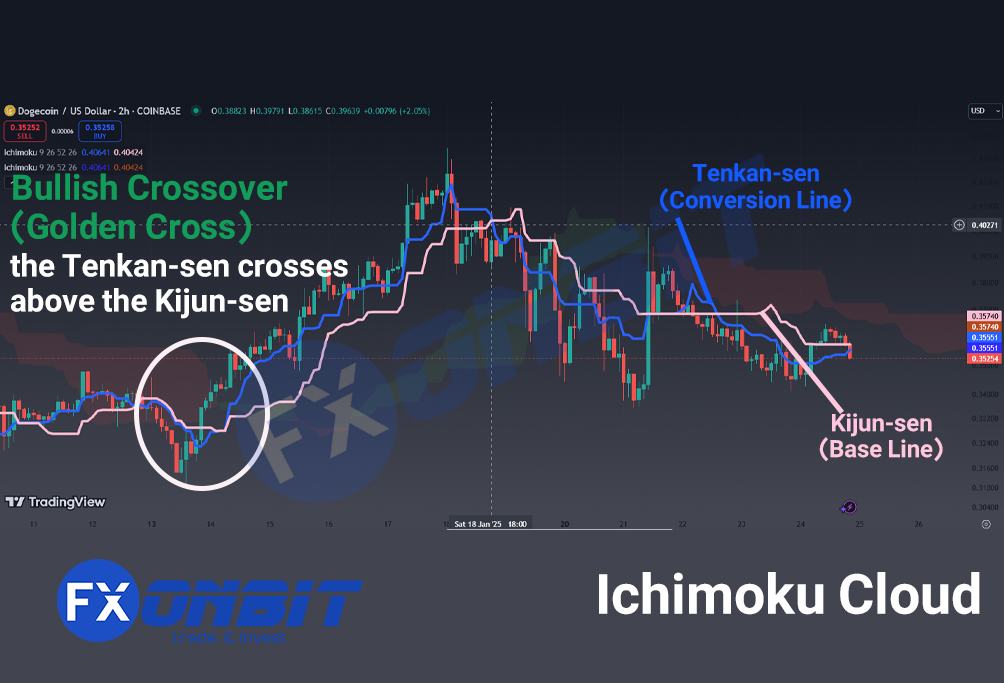
The Tenkan-sen (Conversion Line) and Kijun-sen (Base Line) are pivotal in Ichimoku trading. They provide simple yet powerful signals for market entries and exits.
- Bullish Crossover (Golden Cross):
- Occurs when the Tenkan-sen crosses above the Kijun-sen.
- This indicates a potential upward trend and signals a buying opportunity, especially if the price is above the Kumo (Cloud).
Read more: What is Crypto Whale Tracker? How FXonbit Empowers You to Follow Market Giants
- Bearish Crossover (Death Cross):
- Occurs when the Tenkan-sen crosses below the Kijun-sen.
- This suggests a potential downward trend and signals a selling opportunity, especially if the price is below the Kumo.

- Key Tips for Beginners:
- Confirm the crossover signal with other Ichimoku components, such as the position of the price relative to the Cloud and the Chikou Span.
- Avoid relying solely on crossovers during sideways or consolidating markets, as they may produce false signals.
Components of the Ichimoku Indicator
The Ichimoku indicator consists of the following five components:
- Tenkan-sen (Conversion Line)
- Kijun-sen (Base Line)
- Chikou Span (Lagging Span)
- Senkou Span A (Leading Span 1)
- Senkou Span B (Leading Span 2)
Tenkan-sen (Conversion Line)
Tenkan or Tenkan-sen, also known as the Conversion Line, is one of the curves in the Ichimoku indicator. It is created by connecting multiple points, with each point representing the average of the highest and lowest prices observed over the past 9 periods (e.g., hours, days, or weeks). The formula for calculating Tenkan-sen at a single point is as follows:

Example:
Imagine the highest and lowest prices of a stock over 10 days are as shown in the table below:
Day: 1 | 2 | 3 | 4 | 5 | 6 | 7 | 8 | 9 | 10
Highest Price: 1000 | 988 | 1007 | 1016 | 1056 | 1027 | 1018 | 1058 | 1095 | 1096
Lowest Price: 950 | 976 | 968 | 977 | 1056 | 1013 | 981 | 1040 | 1057 | 1074
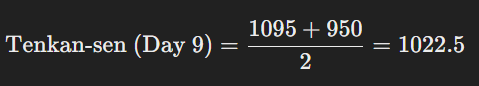
To calculate the Tenkan-sen value for Day 9, we need to find the highest and lowest prices from Day 1 to Day 9. As seen in the table:
- The highest price during this period is 1095.
- The lowest price during this period is 950.
The Tenkan-sen value for Day 9 is:
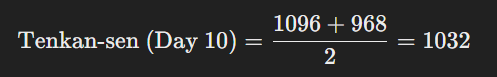
For Day 10, the same calculation is applied using the highest and lowest prices from Day 2 to Day 10:
- Highest price: 1096
- Lowest price: 968
The Tenkan-sen value for Day 10 is:
This process is repeated for each point, forming the Tenkan-sen line on the Ichimoku chart.
Here the Tenkan-sen is displayed in blue.
Read it: 40 Powerful Candlestick Patterns in Forex and Crypto Trading
Kijun-sen (Base Line)
Kijun-sen, also known as the Base Line, is another key component of the Ichimoku indicator. It is calculated similarly to the Tenkan-sen but with one significant difference: instead of using the past 9 periods, it takes the average of the highest and lowest prices over the past 26 periods.
The formula for calculating Kijun-sen at a single point is as follows:

Here the Kijun-sen is displayed in light red.
Chikou Span (Lagging Span)
The Chikou Span, also known as the Lagging Span, is one of the components of the Ichimoku indicator. Each point on this curve represents the closing price of the asset shifted 26 periods back (e.g., hours, days, or weeks). In simpler terms, this line mirrors the price chart but is plotted with a 26-period lag.

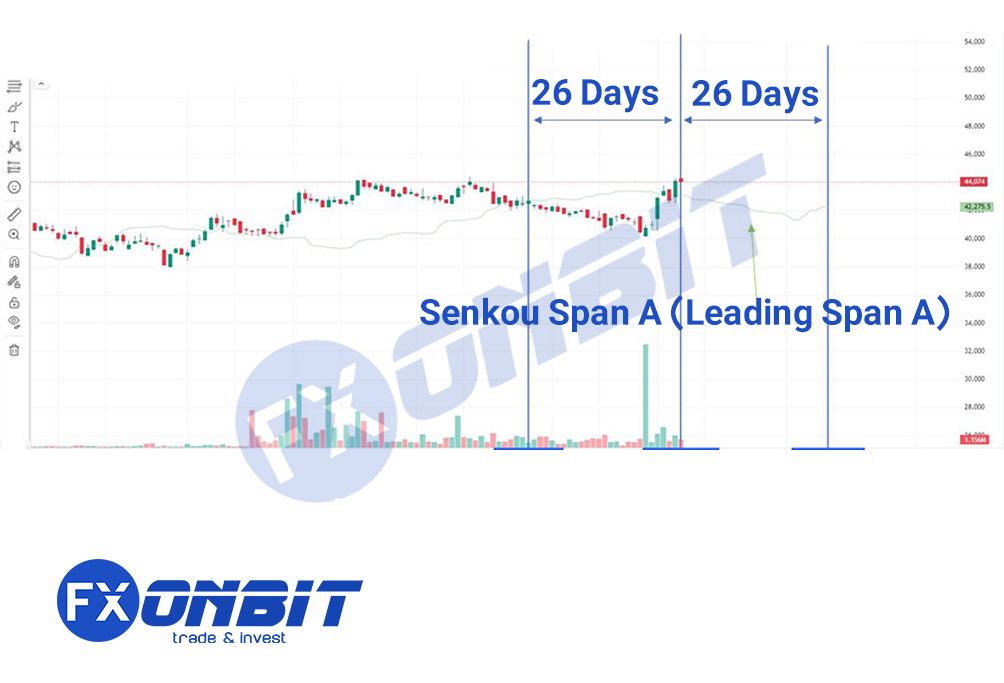
Senkou Span A (Leading Span A)
Each point on the Senkou Span A (Leading Span A) curve represents the average of the Tenkan-sen and Kijun-sen values from 26 periods earlier. In other words, if you calculate the average of today’s Tenkan-sen and Kijun-sen, the result will indicate the value of Senkou Span A for 26 periods in the future.
Senkou Span B (Leading Span B)
The Senkou Span B, also referred to as Leading Span B, represents the average of the highest and lowest prices observed over the 52 periods preceding the current period, but it is plotted 26 periods into the future.

Read more: Weighted Moving Average (WMA): A Comprehensive Guide for Traders
What is the Kumo Cloud in the Ichimoku Indicator?
The Kumo Cloud is one of the most important components of the Ichimoku indicator. The Kumo is the area formed between Senkou Span A and Senkou Span B.
- When Senkou Span A is above Senkou Span B, the Kumo is colored green, indicating a bullish trend.
- When Senkou Span B is above Senkou Span A, the Kumo is colored red, signaling a bearish trend.

The last points of Senkou Span A and Senkou Span B are plotted 26 periods ahead of the current price chart. This forward projection is what gives the Kumo Cloud its predictive nature, allowing it to act as a dynamic indicator of future support and resistance levels.

Explore more: Top Indicators in Crypto Screeners for Effective Tradin
Cloud Breakout Strategies: A Deeper Dive
The Cloud, or Kumo, is the central feature of the Ichimoku indicator and plays a critical role in determining potential trend reversals or continuations. A Cloud breakout strategy revolves around the price breaking either above or below the Cloud, signaling a shift in market momentum. Let’s break this down in greater detail:
Bullish Breakout Explained
A bullish breakout occurs when the price moves decisively above the Kumo, signaling that buyers are gaining control and the market is entering an uptrend.
Key Factors to Consider:
- Cloud Color (Future Kumo):
- A green Cloud ahead indicates bullish sentiment.
- A thick green Cloud provides stronger support, making the breakout more reliable.
- A thin Cloud may suggest weaker support, so proceed with caution.
- Strength of the Breakout:
- The breakout is stronger if the price closes well above the Cloud and doesn’t hover near its boundaries.
- Look for multiple candlesticks closing above the Cloud to confirm the trend.
- Volume as a Confirming Factor:
- High trading volume during the breakout confirms strong buyer interest, making the signal more reliable.
- Weak volume may indicate a false breakout or temporary market fluctuation.
- Additional Confirmation with the Chikou Span:
- The Chikou Span (Lagging Line) should be positioned above the price and the Kumo.
- This alignment confirms that the breakout is supported by bullish momentum.

Practical Example:
- Scenario: On a 4-hour BTC/USDT chart, the price breaks above a thick green Kumo.
- Confirmation: The Chikou Span is above the price and the Kumo, and trading volume surges during the breakout.
- Action: Enter a buy position with a stop-loss just below the Cloud for protection.
Read more: Price Action Trading: The Art of Trading Without Indicators
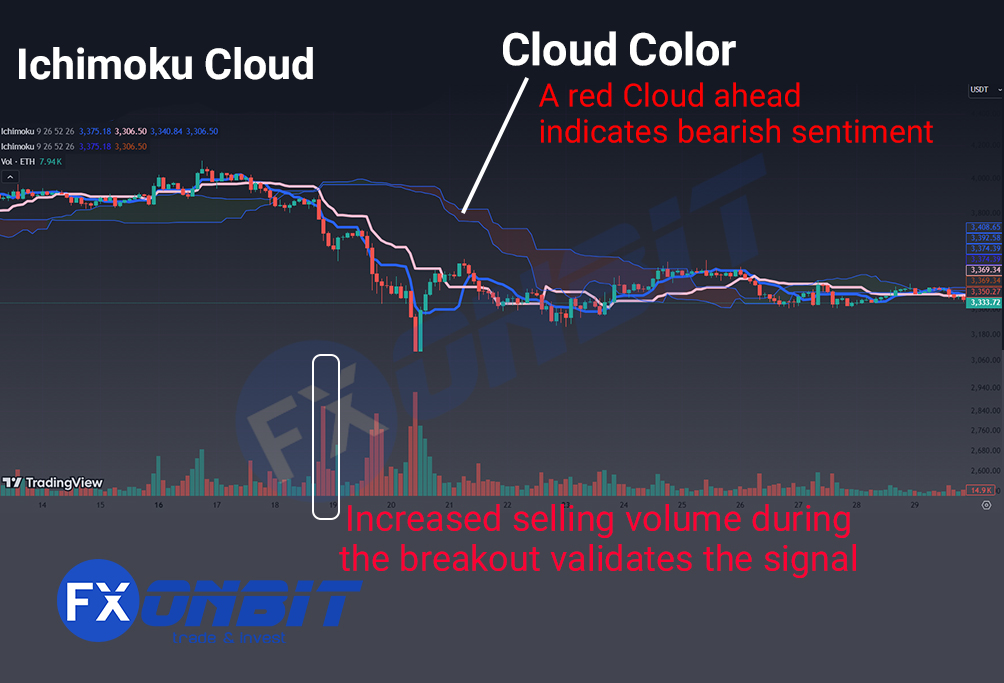
Bearish Breakout Explained
A bearish breakout happens when the price drops below the Kumo, signaling that sellers are dominating and the market may enter a downtrend.
Key Factors to Consider:
- Cloud Color (Future Kumo):
- A red Cloud ahead indicates bearish sentiment.
- A thick red Cloud suggests strong resistance, reinforcing the validity of the breakout.
- A thin Cloud might indicate weaker resistance, requiring additional confirmation.
- Strength of the Breakout:
- A strong bearish breakout will see the price close significantly below the Cloud, with minimal wicks touching the Cloud boundary.
- Consistent downward movement below the Kumo supports the bearish trend.
- Volume as a Confirming Factor:
- Increased selling volume during the breakout validates the signal, indicating strong downward pressure.
- Low volume may signal a false breakdown or temporary dip.
- Additional Confirmation with the Chikou Span:
- The Chikou Span should be positioned below the price and the Kumo to confirm bearish momentum.
- A misaligned Chikou Span can signal a weak breakout or potential reversal.
Practical Example:
- Scenario: On a daily EUR/USD chart, the price drops below a thick red Cloud.
- Confirmation: The Chikou Span is below the price, and the breakout occurs with increased selling volume.
- Action: Enter a sell position with a stop-loss just above the Cloud boundary.
Explore more: What is Crypto Screener? The Best Crypto Screener

Tips for Trading Cloud Breakouts
- Look for Momentum:
- Ensure that the breakout candle is strong, with a clear close above or below the Cloud. Candles with long wicks can signal indecision or rejection of the breakout.
- Volume Confirmation:
- High volume strengthens the reliability of the breakout signal. Breakouts without volume may lead to quick reversals or false signals.
- Chikou Span Alignment:
- Always check the Chikou Span for confirmation. For bullish breakouts, it should be above the price and Kumo. For bearish breakouts, it should be below.
- Avoid Premature Entries:
- Wait for confirmation, such as multiple candlesticks closing outside the Kumo or confirmation from other Ichimoku components.
- Set Risk Management Levels:
- Place your stop-loss just below the Cloud for bullish breakouts or just above the Cloud for bearish breakouts.
- Take profits gradually by identifying previous support/resistance levels or monitoring the thickness of the Cloud ahead.
- Avoid Trading During Consolidation:
- Cloud breakouts are most effective in trending markets. In sideways or consolidating markets, breakouts are more likely to be false.
Read more: How to Customize Crypto Screener to Match Your Trading Strategy
Support and Resistance Using the Cloud
The Kumo acts as dynamic support and resistance, adapting to the market’s volatility and providing more accurate levels compared to static horizontal lines.
- Dynamic Support:
- When the price is above the Kumo, the upper boundary (Senkou Span A) and lower boundary (Senkou Span B) serve as support levels.
- During pullbacks, the price often bounces off the Cloud, resuming the uptrend.
- Dynamic Resistance:
- When the price is below the Kumo, the upper and lower boundaries act as resistance levels.
- In downtrends, the price frequently retests the Cloud but fails to break above, continuing its decline.
- Cloud Thickness:
- Thick Cloud: Represents strong support or resistance, making breakouts more challenging.
- Thin Cloud: Indicates weaker support or resistance, making it easier for the price to break through.
- Practical Example:
- In a bullish trend, if the price pulls back into the Kumo and bounces off its upper boundary, it signals a buying opportunity. Similarly, in a bearish trend, if the price touches the lower boundary and moves back down, it indicates a selling opportunity.
Explore more: Liquidity; The Backbone of Financial Markets
Ichimoku Cloud for Trend Analysis
One of the key strengths of the Ichimoku Cloud is its ability to help traders identify and analyze long-term trends with ease.
- Bullish Trend:
- Price is above the Kumo.
- The Cloud ahead is green, and the Tenkan-sen is above the Kijun-sen.
- The Chikou Span is above the price, confirming strong bullish momentum.
- Bearish Trend:
- Price is below the Kumo.
- The Cloud ahead is red, and the Tenkan-sen is below the Kijun-sen.
- The Chikou Span is below the price, signaling strong bearish momentum.
- Ranging Market:
- When the price is inside the Kumo, it suggests consolidation or indecision in the market.
- Avoid trading in such conditions and wait for a clear breakout above or below the Cloud.
- Trend Strength:
- Thick Clouds: Indicate a strong and stable trend.
- Thin Clouds: Suggest a weaker trend that may be prone to reversals.

Ichimoku Cloud and Timeframes
The effectiveness of the Ichimoku Cloud varies depending on the timeframe and the market. Choosing the right timeframe is crucial for successful trading.
Best Timeframes for Different Markets
- Forex Trading:
- Recommended timeframes: 1-hour, 4-hour, and daily charts.
- Forex markets operate 24/5, and Ichimoku works well for both short- and medium-term trades.
- Cryptocurrency Trading:
- Recommended timeframes: 15-minute, 1-hour, and 4-hour charts.
- Due to the high volatility and 24/7 nature of crypto, shorter timeframes are often preferred.
- Stock Trading:
- Recommended timeframes: Daily and weekly charts.
- Stocks tend to have slower-moving trends, making higher timeframes more reliable.
Adjusting Ichimoku Settings for Different Markets
While the default settings (9, 26, 52) work well for most markets, they can be adjusted based on the specific characteristics of the asset being traded.
- Forex:
- Stick to default settings for consistency and reliability.
- Cryptocurrency:
- Use shorter settings, such as (6, 24, 48), to capture faster price movements and trends.
- Stocks:
- Consider longer settings, such as (12, 36, 72), to filter out noise and focus on major market trends.
Key Tips for Timeframes and Settings
- Always confirm signals on higher timeframes before entering a trade. For example, verify a 1-hour bullish breakout by checking the 4-hour or daily chart.
- Adjust the settings based on backtesting results to find the most effective parameters for your preferred trading style and market.
Entry and Exit Strategies Using Ichimoku Cloud
- Entry Strategies:
- Enter trades after price breaks above or below the Kumo, confirming the trend direction.
- Use the Chikou Span (Lagging Line) as an additional confirmation tool. Enter only when it supports the trend (above price for bullish, below for bearish).
- Exit Strategies:
- Exit trades when the price re-enters the Kumo, signaling potential consolidation or reversal.
- Use crossovers of Tenkan-sen and Kijun-sen in the opposite direction as exit points.
Risk Management with Ichimoku Cloud
- Stop Loss Placement:
- Place stop losses just outside the Kumo (above for sell positions, below for buy positions).
- For crossovers, use recent swing highs or lows as stop-loss levels.
- Take Profit Levels:
- Use the next boundary of the Kumo or previous price levels as targets.
- Adjust profit-taking strategies based on the thickness of the Cloud (thicker Clouds may indicate a stronger trend and longer potential moves).
Limitations of the Ichimoku Cloud
- Not Ideal for Choppy Markets:
- In sideways or consolidating markets, Ichimoku tends to generate false signals. Combining it with other indicators like RSI or Bollinger Bands can help filter these signals.
- Complexity for Beginners:
- While powerful, the indicator can be overwhelming for new traders. Breaking it into parts, as discussed, helps simplify learning.
- Lagging Nature:
- Some components, like the Chikou Span, are lagging indicators. They confirm trends but may not be helpful for very early entries.
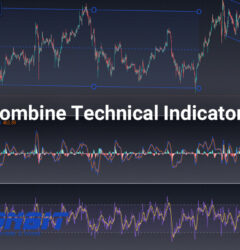
Combining Ichimoku Cloud with Other Indicators
- Pair the Ichimoku Cloud with other tools to enhance its accuracy:
- RSI (Relative Strength Index): Helps confirm overbought or oversold conditions.
- MACD (Moving Average Convergence Divergence): Validates momentum in the same direction as Ichimoku signals.
- Fibonacci Retracements: Aligns retracement levels with the Kumo for strong areas of support or resistance.
Real-Life Use Cases
- Forex Example:
- EUR/USD experiences a bullish breakout above the Kumo on the 4-hour chart. The Tenkan-sen and Kijun-sen crossover aligns with the Chikou Span being above the price. This signals a strong uptrend, prompting a buy trade.
- Cryptocurrency Example:
- BTC/USDT on the 1-hour chart shows a bearish breakout below a thin Cloud. Volume spikes confirm the move, providing an opportunity for a short trade.
Explore more: Filtering High-Volume Cryptos: Guide to Finding Liquidity with Screeners
Advanced Tips for Ichimoku Cloud Users
- Kumo Twists:
- Pay attention to “Kumo Twists,” where Leading Span A crosses Leading Span B. These often indicate potential trend reversals or weakening trends.
- Backtesting Strategies:
- Use platforms like TradingView to backtest Ichimoku strategies with different settings and on various timeframes.
- Practice Different Markets:
- Try Ichimoku on indices, commodities (e.g., gold or oil), and other instruments to understand its versatility.
FAQs for Beginners
- Can Ichimoku Cloud be used for scalping?
- Yes, but only on lower timeframes (e.g., 5-minute or 15-minute charts) and in trending markets.
- How often should I adjust Ichimoku settings?
- Settings should align with your market and timeframe but don’t adjust too frequently. Test new settings thoroughly before applying them.
- What’s the best way to learn Ichimoku Cloud?
- Practice on demo accounts, analyze historical charts, and start with simple strategies like crossovers before diving into advanced techniques.
Common Beginner Mistakes to Avoid
- Ignoring the Overall Trend: Always consider the bigger picture. For example, don’t take a bullish signal on a 15-minute chart if the daily chart shows a strong downtrend.
- Entering Trades Too Early: Wait for confirmation of breakouts or crossovers before placing trades.
- Not Using Stop Losses: Always protect your trades by placing stop-loss orders based on the Kumo or recent swing levels.
Hi, I’m Asena, a Senior Marketing Specialist with over 8 years of experience and a deep passion for trading knowledge. I have a genuine fascination with the world of Crypto and Forex markets. Over the past 6 years, I’ve dedicated myself to writing about technical analysis, fundamental analysis, and the intricate dynamics of these markets. My mission is to provide the most complete and comprehensive data to empower my audience with actionable insights. I truly love what I do and constantly strive to deliver the best possible results for my readers and users.

Asena Taremi