30 Jan

For day traders, Volume Analysis is one of the most critical indicators to gauge market sentiment and price action on a short-term basis. Understanding volume can help identify breakouts, trends, and reversals, ultimately improving the chances of maximizing profits.
Find Volume in Our Free Crypto & Forex Screener Dashboard

Here are several specific tips on using volume effectively for day trading:
1. Confirm Breakouts with Volume Analysis
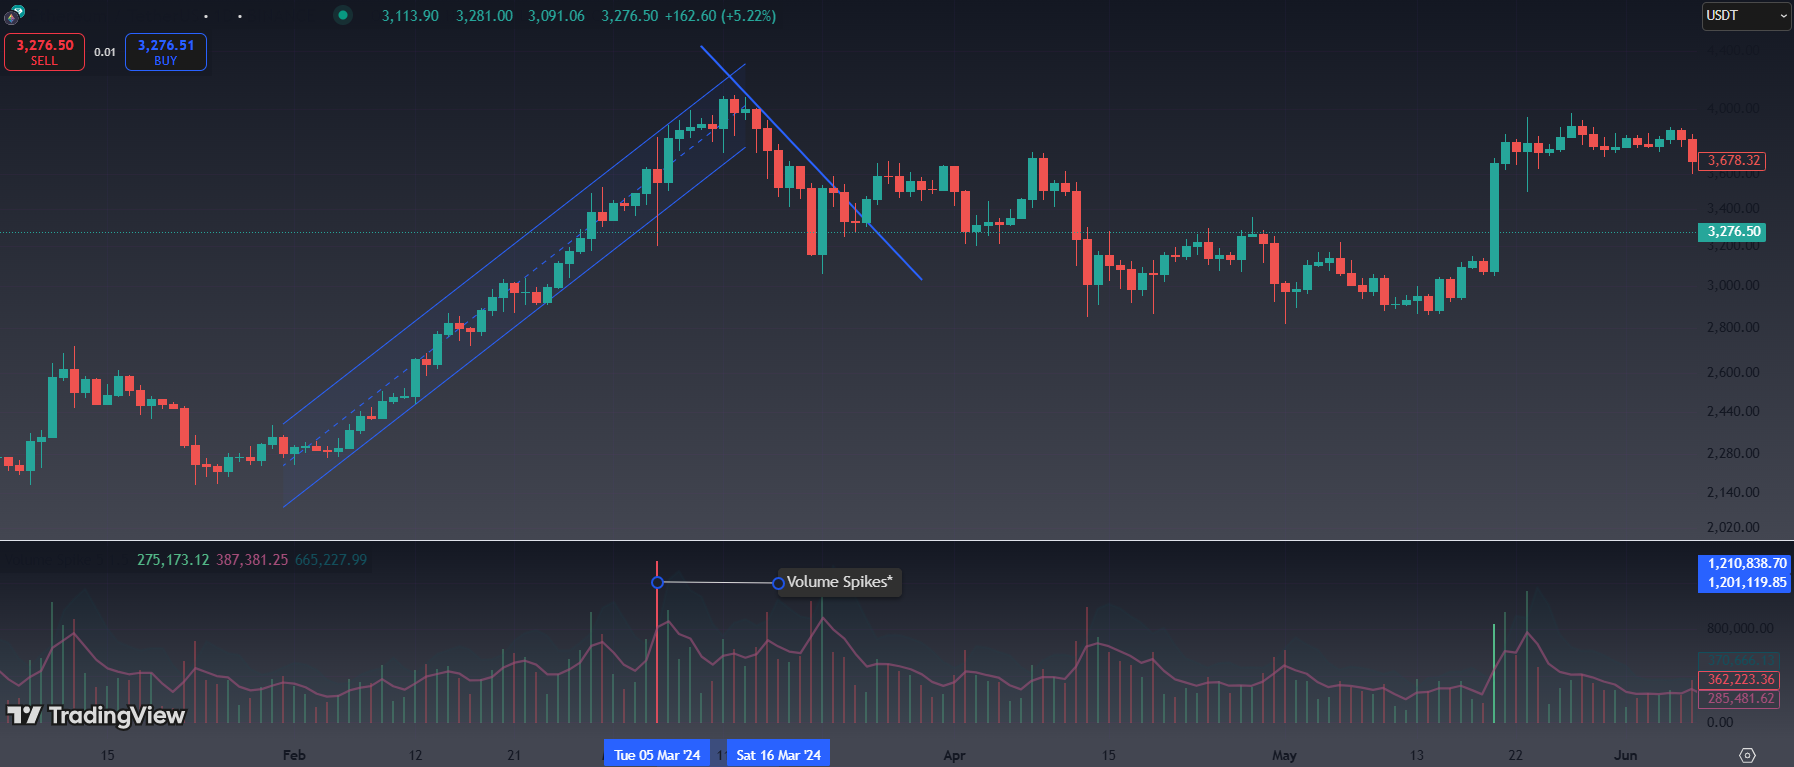
One of the most powerful tools for day traders is using volume to confirm whether a breakout is real and likely to continue. A breakout happens when the price moves strongly beyond a support or resistance level. However, not all breakouts are created equal. For a breakout to be reliable, it should be accompanied by increasing volume.
Here’s why and how you can use this to your advantage:
Why It Works:
- Market Conviction: When a breakout happens, volume increases because more traders are entering the market. This surge in volume shows that the market is committed to the price move, and it’s not just a small group of traders driving the change. Essentially, it’s a sign that many market participants believe the breakout will continue and that the trend is strong.
- Volume as Confirmation: If the price breaks through a resistance or support level, but volume does not increase, it suggests that the move may be weak and not well-supported by the market. A price move with low volume is more likely to reverse because fewer traders are involved in the move. On the other hand, increasing volume confirms that the move has real market support, making it more likely to continue.
- More Traders, Stronger Trend: As volume rises during a breakout, it shows that more traders are jumping on board, which strengthens the trend and makes the breakout more sustainable. It’s a sign of strong market sentiment in the direction of the breakout.
Read more: Best Crypto Screener for Trading
Explore more: Understanding Volume in Trading: A Beginner’s Guide
How to Use It:
- Wait for the Breakout to Happen:
- The first step is to identify key support or resistance levels. These are the levels where price has previously bounced or reversed. Once the price approaches these levels, you can watch for a breakout—a move that goes past these levels decisively.
- Check for Volume Confirmation:
- After the price breaks through a key level, look at the volume. For a breakout to be considered strong, the volume should increase as the price moves beyond the support or resistance level.
- High Volume: If the volume is significantly higher than average, it confirms that many traders are participating in the move. This indicates that the breakout is likely to continue in the same direction.
- Low Volume: If the volume is low or unchanged during the breakout, be cautious. A breakout without sufficient volume suggests that the price movement may not have enough momentum to keep going, and the breakout could be a false signal.
- Enter the Trade:
- Once you confirm that the breakout is supported by increasing volume, you can consider entering a position in the direction of the breakout.
- For a bullish breakout (price moving up), enter a long position. For a bearish breakout (price moving down), enter a short position.
- Set a stop loss just outside the breakout level (for example, slightly below resistance if you are buying) to protect against any potential price reversal.
- Monitor Volume as the Trend Develops:
- As the price continues in the direction of the breakout, continue to monitor volume. If volume remains high or continues to increase, it indicates that the trend is likely to remain strong. If volume starts to decline as the trend moves, it could signal that the breakout is losing momentum and that a reversal may be coming.
Explore more: Filtering High-Volume Cryptos: Guide to Finding Liquidity with Screeners
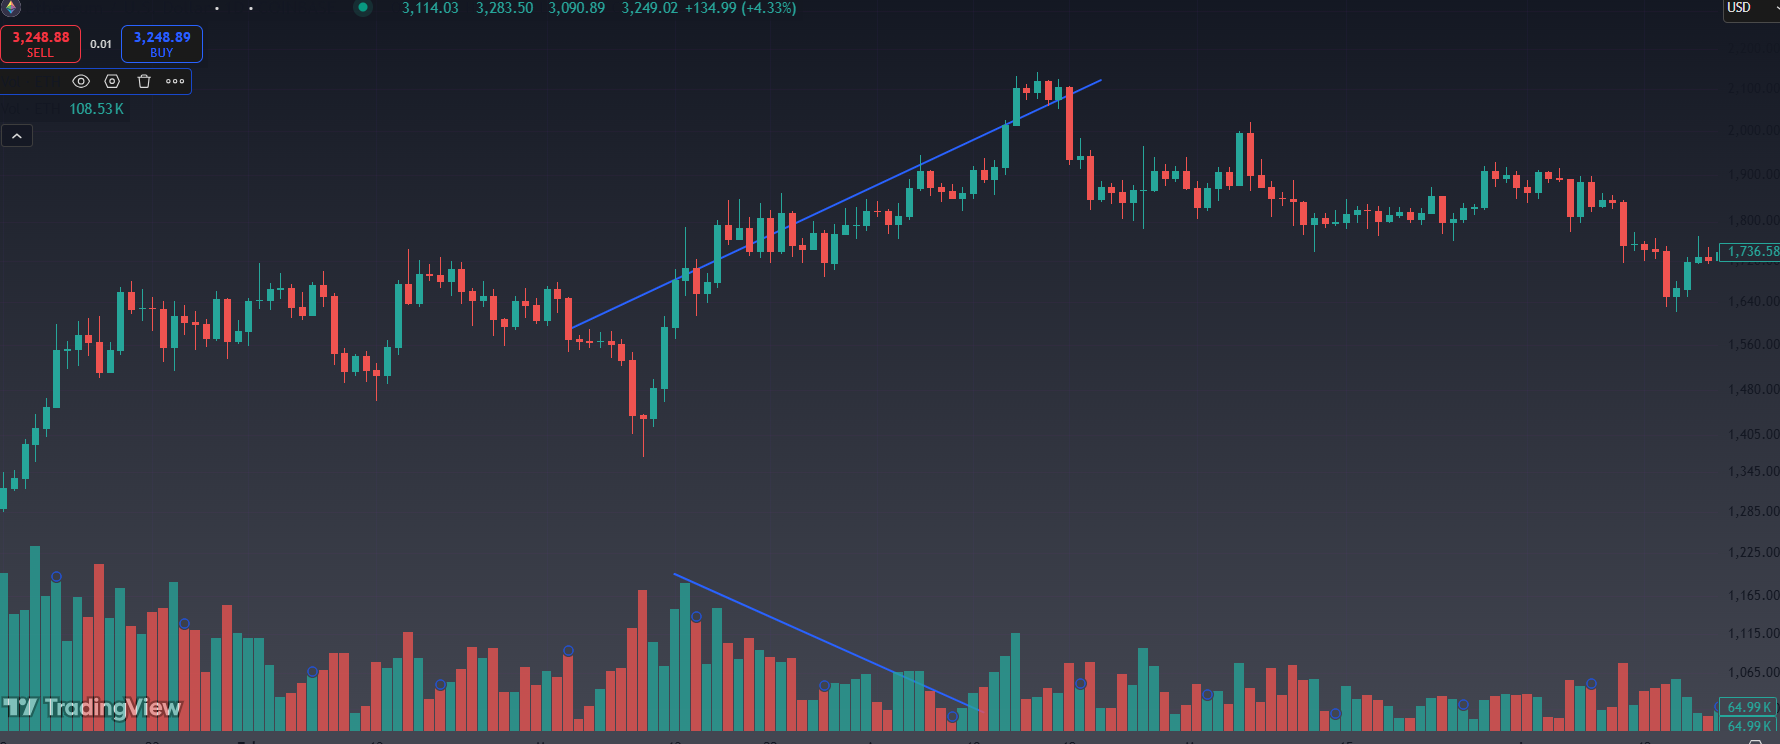
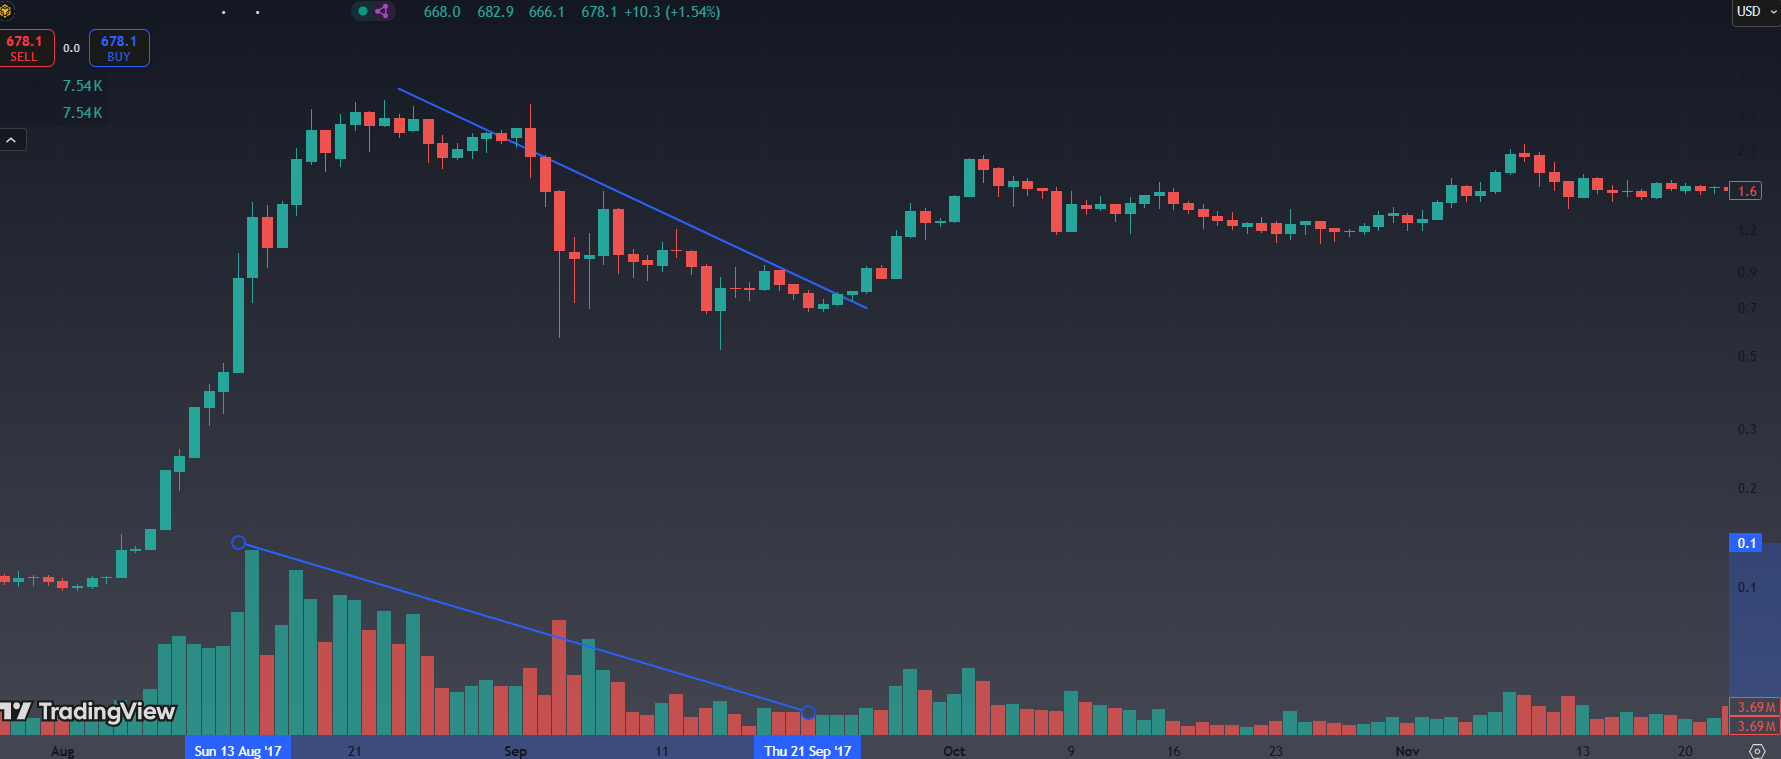
2. Look for Volume Divergence
Volume divergence is a powerful concept for day traders to spot potential reversals or consolidations. It occurs when price and volume move in opposite directions, signaling that the trend may be losing strength and a reversal could be on the horizon. By recognizing volume divergence, traders can anticipate market shifts before they occur, giving them a significant edge.

Explore more: How to Combine Technical Indicators for More Accurate Trade Signals
What is Volume Divergence?
- Volume Divergence happens when price moves in one direction (either up or down) while volume behaves differently (either decreasing or increasing).
- Price and Volume Mismatch: Normally, you want volume to increase when the price moves in a specific direction. For example, if the price is rising, volume should typically increase as more traders join in to push the price higher. If volume declines while the price moves up, it suggests that the trend could be weakening.
Explore more: How to Use Volume to Confirm Market Trends and Read Market Sentiment
How Volume Divergence Signals Reversals or Loss of Momentum:
- Price Moving Higher, Volume Declining:
- Example: If the price is moving up, but the volume is decreasing, it indicates that the buying interest is weakening. Fewer traders are supporting the price rise, which could signal that the uptrend is running out of steam. This is an early warning that the trend might reverse or go into consolidation.
- Why It Matters: When the price rises but volume decreases, it shows that fewer traders are joining in on the trend. The market is losing conviction in the uptrend, and without continued participation, the price could soon reverse. This is an important warning signal for day traders to avoid entering new positions in the same direction and prepare for a possible trend reversal.
Explore more: What is MACD? Full Guidance
- Price Moving Lower, Volume Declining:
- Example: Similarly, if the price is falling, but the volume is decreasing, it indicates that selling interest is fading. While the price may continue to drop, the decreasing volume shows that fewer traders are eager to participate in the sell-off, which could suggest that the downtrend is weakening.
- Why It Matters: A downtrend with declining volume suggests that sellers are losing confidence and that the selling pressure is not sustainable. The lack of new participants indicates that the downtrend may not have enough strength to continue. This divergence can signal an upcoming reversal to the upside or a consolidation phase.
Read more: Mastering the Martingale Trading Strategy
Why Volume Divergence Matters:
- Early Alert for Trend Reversal: Recognizing volume divergence early allows traders to anticipate a potential trend reversal before it happens. A trend with low or decreasing volume is much more fragile, and volume divergence is a strong indicator that the trend may be losing momentum.
- Avoiding False Moves: Sometimes price can continue moving in the same direction despite low volume, but this can often be a false move or a weak continuation. If the price continues to rise or fall without increasing volume, it suggests that the move might not be backed by strong market participation and could reverse soon. By spotting these divergences, traders can avoid chasing weak price movements and can instead wait for more confirmation or a better entry point.
- Identifying Consolidation or Accumulation: Volume divergence doesn’t always indicate an immediate reversal. Sometimes, it signals that the market is transitioning into a consolidation phase, where the price moves sideways before a breakout or breakdown. This can be an important signal for traders to prepare for a range-bound market or a potential new trend.
Explore more: Analyzing Volume Patterns for Breakout & Reversal Signals
How to Use Volume Divergence in Your Trading Strategy:
- Watch for Divergence During Trend Moves:
- If you notice that the price is moving in one direction (either up or down), check the volume. If volume starts declining as the price moves in the same direction, you are likely seeing volume divergence. This could be an early sign that the price move is weakening and that a reversal is possible.
- Wait for Confirmation:
- Don’t act solely on volume divergence. Always wait for price action confirmation of a trend reversal. For example, if the price is rising but volume is falling, and you notice a price rejection (a candlestick pattern showing rejection, such as an inverted hammer or doji), this could be confirmation that the trend is about to reverse.
- Monitor Price Behavior After Divergence:
- After identifying volume divergence, monitor the next price movement. If the price starts moving in the opposite direction (such as a pullback or trend reversal), it can confirm that the divergence was a valid signal. If the price resumes the original direction with strong volume, it could be a false signal, so traders should be cautious and adjust their strategy accordingly.
- Use Divergence with Other Indicators:
- Combine volume divergence with other technical indicators to improve the accuracy of your trades. For example:
- If you see volume divergence with RSI showing an overbought or oversold condition, it could strengthen the case for a reversal.
- MACD crossovers can also help confirm that the trend is losing momentum, especially when combined with volume divergence.
- Combine volume divergence with other technical indicators to improve the accuracy of your trades. For example:
Explore more: Crypto Grid Trading Strategy Ultimate Guide for Profitable Market Trading
Example of Volume Divergence in Action:
Let’s say you’re day trading Bitcoin and notice that the price is rising over the course of the day, but volume has started to decline. The price may continue to rise for a short period, but this volume decline suggests the uptrend is weakening.
- Step 1: Monitor the price: The price rises, but you see the volume start to decline.
- Step 2: Watch for price patterns like candlestick reversals (e.g., a shooting star candlestick on a 15-minute chart), indicating a potential reversal.
- Step 3: After seeing a candlestick reversal, you could enter a short position, expecting a pullback or reversal in price.
This type of early warning signal provided by volume divergence helps you avoid getting caught in a weak trend and allows you to trade with better insight into the market’s true strength.
Explore more: Best Forex Screeners for Day Trading
Key Takeaways for Day Traders:
- Volume Divergence is a critical signal for identifying when a trend is losing momentum, which may precede a trend reversal or a consolidation phase.
- Volume decline during a price increase suggests a weakening uptrend, while volume decline during a price decrease suggests a weakening downtrend.
- Wait for confirmation: Use volume divergence as an early signal and confirm the potential reversal with price action or other indicators like RSI or MACD.
- Use volume divergence with caution, especially in volatile markets, as it can also indicate consolidation before a breakout, not just a reversal.

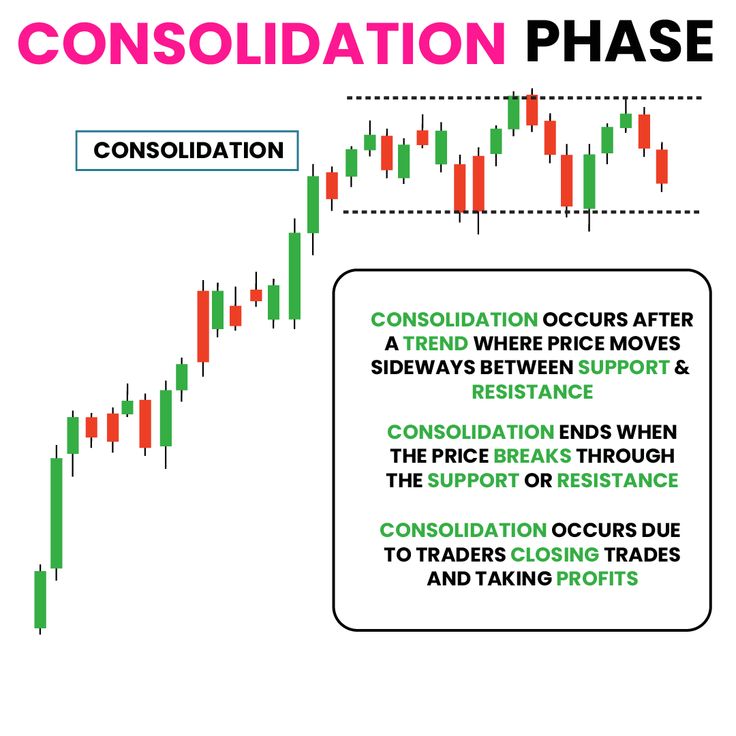
3. Monitor Volume During Consolidation Phases
Consolidation phases, or sideways markets, are common in many trading environments. During these periods, the price moves within a specific range, bouncing between support and resistance levels. While price action during consolidation can seem uneventful, it’s an important period where volume analysis can provide powerful insights into the next major price move. Here’s how to use volume to spot breakout opportunities during consolidation:
Why It Works:
- Low Volume in Range-Bound Markets: During consolidation, the market is sideways and typically experiences lower volume because traders are indecisive and waiting for more information. The price moves between defined support and resistance levels, and without strong conviction from market participants, volume tends to remain lower.
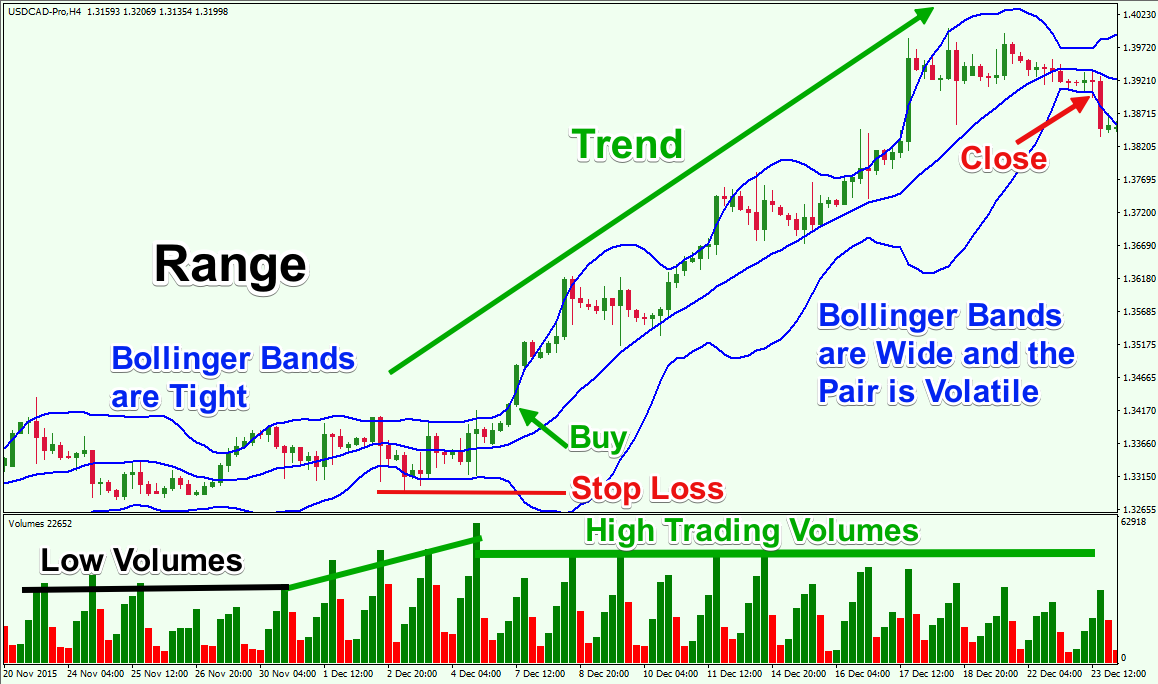
- Volume Spike Signals Action: However, when volume spikes during a consolidation phase, it signals that market participants are suddenly active, and it’s a sign that a significant move might be coming. The volume surge is often the first sign that the market is preparing for a breakout in either direction—upward or downward.
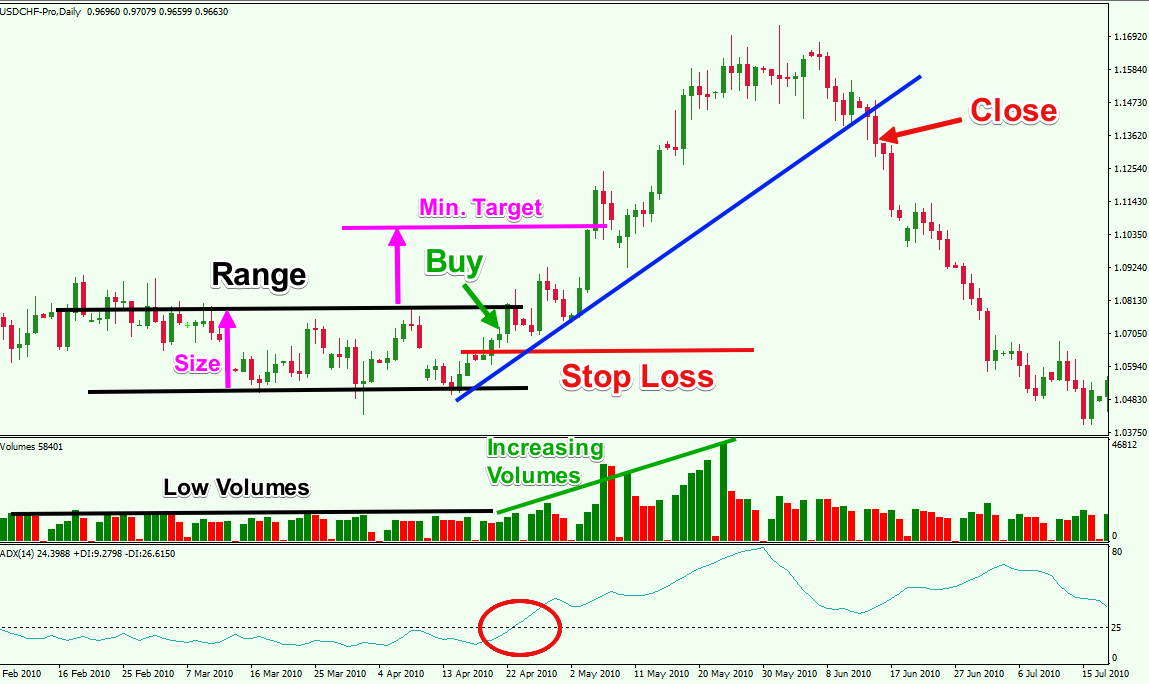
- Why It Matters: A volume surge during consolidation suggests that traders are either entering new positions or reacting to new information, pushing the price to break out of the established range. A breakout with increased volume is more likely to be sustained, as it shows that many market participants are supporting the move. Without a surge in volume, a breakout can be a false signal, often referred to as a fakeout, which means the price could quickly reverse back into the range.
How to Use It:
- Identify the Consolidation Range:
- The first step is to identify a consolidation phase. This is when the price moves sideways, bouncing between well-defined support and resistance levels. During consolidation, the market often appears to lack direction as the price is trapped in a range.
- Look for consistent support (the lower level where price tends to stop falling) and resistance (the upper level where price tends to stop rising) levels. These levels will form the range.
- Monitor for Volume Surges:
- While the price is consolidating, volume typically remains low. However, watch for volume surges—an increase in trading volume during consolidation.
- A volume surge can be seen when the price breaks past the high or low of the consolidation range, and it’s supported by significantly higher-than-average volume. This is a strong indication that traders are becoming active and positioning themselves for the next price move.
- How to Spot a Surge: Volume should increase sharply, and the price should break through a key level (either support or resistance). For instance, if price approaches resistance and volume starts increasing, it could signal that a bullish breakout is coming. Conversely, if volume surges as the price approaches support, it might indicate a bearish breakdown.
- Wait for Price to Break Out with Confirmed Volume:
- Don’t jump in as soon as you notice a volume surge. You need to wait for price confirmation that the breakout is real and not just a short-lived fluctuation.
- When the price breaks past resistance (for a bullish breakout) or breaks below support (for a bearish breakdown), make sure that the volume is still increasing as the price moves. This is your confirmation that the breakout is likely to continue and is not just a temporary move.
- Enter the Trade:
- Once the breakout is confirmed with increasing volume, you can enter the trade in the direction of the breakout. For a bullish breakout, enter a long position, and for a bearish breakout, consider a short position.
- Set Stop Loss: To protect against false breakouts, you should place a stop loss just below the breakout level (for a bullish breakout) or above the breakout level (for a bearish breakdown). This will help limit your risk if the breakout turns out to be a fakeout or a false move.
- Monitor the Trend After the Breakout:
- After entering your position, keep an eye on volume and price action. If the price continues in the breakout direction with increasing volume, the trend is likely to continue.
- If volume starts to decline as the price moves, it could indicate that the breakout is losing momentum and could be followed by a reversal. In such cases, be ready to exit the trade or adjust your stop loss to lock in profits.
Read more: Weighted Moving Average (WMA): A Comprehensive Guide for Traders
Read more: What is Crypto Whale Tracker? How FXonbit Empowers You to Follow Market Giants
Key Considerations:
- Avoid False Breakouts: If the breakout happens with low volume, be cautious. Low-volume breakouts often result in false moves or fakeouts, where the price moves briefly outside the range but then quickly reverses. Always look for confirmed volume to avoid getting trapped in a false breakout.
- Risk Management: Breakouts can lead to strong price moves, but they can also quickly reverse. Set a stop loss just outside the range (slightly below support for a bullish breakout, or slightly above resistance for a bearish breakout) to manage your risk in case the breakout fails.
- Watch for Continuation Patterns: Once a breakout occurs, look for continuation patterns such as flags or triangles that may indicate that the price will continue in the breakout direction. These patterns can help reinforce the idea that the breakout is not a temporary blip.
Example of a Breakout with Volume Surge:
Let’s say you are monitoring Ethereum (ETH), and the price has been trading within a defined range for several days, bouncing between $1,800 (support) and $2,000 (resistance). The volume during this period has been relatively low, indicating indecision in the market.
Then, you notice a sudden surge in volume as the price approaches the $2,000 resistance level. As the price breaks above $2,000 with a sharp increase in volume, it confirms that the market is taking action, and the breakout is likely to continue in the bullish direction.
- Action: You decide to enter a long position as the price breaks above $2,000 and volume confirms the breakout. You set your stop loss just below $2,000 to protect against a potential false breakout.
- Outcome: The price continues rising, supported by increasing volume. You can ride the trend as the breakout becomes stronger, and adjust your stop loss to lock in profits as the price moves higher.
Explore more: What is Crypto Screener? The Best Crypto Screener

4. Use Volume Analysis for Risk Management
In day trading, risk management is just as important as identifying opportunities. Volume analysis plays a crucial role not only in spotting potential trades but also in limiting potential losses. By using volume to evaluate the strength of price movements, traders can avoid entering trades that might reverse or become less reliable, giving them the tools to manage risk effectively. Here’s how to use volume to protect your capital and make better trading decisions:
Why Volume Matters for Risk Management:
Volume is a powerful tool for confirming the reliability of a price move. Price movements supported by strong volume are more likely to continue, while those with low volume are often weak and prone to reversal.
By understanding the relationship between volume and price, traders can improve their risk management strategies.
1. Spot Weak Moves with Low Volume
When prices move, but volume is low, it suggests that fewer market participants are involved in the price move. This can indicate weak participation and make the price movement more vulnerable to reversal. Weak moves with low volume can be seen in situations where:
- Price moves against the prevailing trend with little volume.
- Price breaks a key level, but volume does not rise significantly.
Why It’s Important:
- Lack of Market Participation: Low volume during a price move indicates that there isn’t much market conviction behind the move. Fewer traders are participating, which means the price movement may not have enough momentum to sustain itself.
- Risk of Reversal: These weak moves are often followed by reversals or false breakouts, where the price moves in the opposite direction. This makes entering trades based on low-volume moves risky.
What to Do:
- Wait for Volume Confirmation: If you spot a price move with low volume, be cautious about entering a position. Wait until volume picks up or see if the price moves in the same direction with increasing volume before deciding to enter. This will help you confirm that the trend has sufficient strength to continue.
- Avoid Chasing Low-Volume Moves: Do not chase price movements that occur with insufficient volume. These moves are likely to be short-lived and could lead to quick reversals that trap traders.
Read it: How to Identify Breakouts by Crypto Screener
2. Stop Loss Placement Using Volume Insights
Volume can also help with placing stop losses, one of the most essential tools for protecting your trades. A stop loss ensures that you limit your losses if the market moves against you. Here’s how volume can help you place smarter stop losses:
Using Volume to Define Stop Loss Levels:
- For Breakouts: When trading a breakout, volume can help determine where to place your stop loss. If the price breaks out of a key support or resistance level, you want to place your stop loss just below the breakout level (for a bullish breakout) or above the breakout level (for a bearish breakout).
- Confirm Breakout with Volume: Wait for a volume surge to confirm that the breakout is supported by strong market participation. Once confirmed, place your stop loss just outside the breakout level to protect yourself if the breakout turns out to be false or the market reverses.
Example:
- If you are entering a long position after the price breaks above resistance, and the volume increases significantly, place your stop loss just below the former resistance level (now acting as support). This ensures that if the price retraces or reverses, your position is protected.
- For a short position, place your stop loss just above resistance (now acting as resistance after the breakout).
Why It Works:
- Volume confirms the strength of the breakout: A strong volume increase signals that more traders are involved, making the move more reliable. If the price retraces back and hits your stop loss, you know the trend likely wasn’t strong enough to sustain itself. This helps you avoid larger losses.
- Tighter Stops in Low-Volume Markets: If the volume during a breakout or price move is low, consider placing your stop loss tighter. This minimizes the risk if the move turns out to be weak. In a low-volume market, your stop loss will protect you from getting caught in false breakouts or reversals.
Read more: FXonbit CandleStick Pattern Finder Service: Your Gateway to Smarter Forex and Crypto Trading
3. Adjusting Risk Based on Volume Trends
Volume also provides valuable insights into market sentiment and can help traders adjust their risk tolerance.
- Strong Volume: When volume is high and increasing, it suggests that the market is confident in the price direction. You can afford to place wider stop losses because the move has more momentum behind it, reducing the likelihood of a reversal.
- Low Volume: If volume is weak or declining, it signals that the move may not be backed by strong participation, and the trend could lose momentum. In these cases, it’s wise to use tighter stop losses to minimize potential losses if the market reverses.
Example:
- If you are in a trade during a period of low volume, you might use tight stop losses because the market is less certain, and price moves can be easily reversed. In contrast, during high volume, you might give the price more room to move before triggering your stop loss.
4. Volume as a Risk Signal for False Breakouts
False breakouts occur when the price breaks above resistance or below support but fails to continue in the breakout direction. These fakeouts can be costly for day traders if not properly managed. Here’s how volume can help you avoid entering trades based on false breakouts:
What Happens in a False Breakout?
- In a false breakout, the price breaks through a key level (support or resistance), but volume does not confirm the move. In these cases, the price quickly reverses, leaving traders who entered based on the breakout with a losing position.
How Volume Helps:
- If the breakout occurs but the volume remains low or even decreases, it is a warning signal that the breakout may not be sustainable. In these situations, it’s best to wait for the volume to increase significantly before entering a position.
- Key Risk Management: If you’ve already entered a breakout trade with low volume, tighten your stop loss or exit the trade quickly if the price begins to reverse. This reduces the impact of false breakouts on your trading strategy.
Explore more: On-Balance Volume (OBV): A Complete Guide for Traders
Volume and Volatility: Their Relationship for Better Trading Decisions
Volume and volatility are closely connected in financial markets, and understanding their relationship can significantly improve your trading decisions. Both provide valuable insights into price movements and market conditions. Here’s a more organized breakdown of how you can use the relationship between volume and volatility to optimize your trading strategy:
1. Volume and Volatility Are Directly Linked
How It Works:
- Increased Volume = Higher Volatility: When volume surges, it generally indicates that more traders are entering the market. This increased market participation can lead to larger price movements, also known as higher volatility.
- Lower Volume = Lower Volatility: Conversely, when volume is low, market participation is weak, and price movements tend to be less volatile and more stable.
Why It Matters:
- When volume surges, the increased participation often results in larger price swings. Higher volatility can create profitable opportunities for traders willing to manage the increased risk, as prices move more drastically.
- Example: During major economic announcements, central bank decisions, or earnings reports, you’ll often see a surge in volume, leading to higher volatility. Traders can use this to capitalize on larger price moves.
Actionable Tip:
- Increased Volume with volatility means the market is moving with strong conviction. This gives traders confidence to enter trades aligned with the direction of the move.
- However, low volume during high volatility could signal that the price moves are more speculative and may be subject to quick reversals. In these cases, traders should be cautious and wait for further confirmation before entering trades.
2. Using Volume to Gauge the Strength of Volatility
How It Works:
- High Volume + High Volatility: When volatility is high and volume is also increasing, it indicates strong market participation. This often means that the price move has a higher chance of continuation and is supported by broad market sentiment.
- Low Volume + High Volatility: If volatility is high but volume is low, it can indicate that the market is not fully convinced by the price move. Low volume in a volatile market can result in false breakouts or sharp reversals, as the price movement may not be sustainable.
Why It Matters:
- High Volume with Increased Volatility means that traders are actively engaged, and the price move is likely legitimate and supported by market sentiment. This type of setup gives traders confidence that the price move will continue in the same direction.
- Low Volume with High Volatility suggests the opposite—there may be speculation or false signals involved, and traders should be cautious. These situations are more prone to reversals, so waiting for higher volume confirmation is important.
Actionable Tip:
- Enter with confidence when you see high volume during periods of high volatility, as it indicates strong momentum behind the move.
- If you notice low volume during volatile moves, consider using tight stop losses or delaying entry until volume increases, confirming that the trend is sustainable.
3. Volume Helps Predict Volatility in Certain Market Conditions
How It Works:
Volume can also predict future volatility, especially during key events like earnings season, central bank meetings, or geopolitical announcements. Here’s how:
- Pre-News Volume: Before a major event or announcement, you might notice increased volume. This typically means that the market is anticipating volatility, with traders positioning themselves based on expectations of what the news will bring.
- As the news is released, volume often surges, and volatility spikes. This creates trading opportunities for those who understand how volume relates to volatility.
- Volume-Weighted Average Price (VWAP): The VWAP indicator can help traders assess the strength of a price move by taking into account both volume and price. When the price moves away from the VWAP with increasing volume, it often signals that the price movement has sufficient momentum to continue in that direction.
Why It Matters:
- Increased volume before major events signals that market participants are anticipating volatility. This allows traders to prepare for larger price movements, either in the direction of the anticipated news or as the market reacts to surprises.
- The VWAP helps traders understand whether a move is supported by both volume and price, indicating the strength of the move.
Actionable Tip:
- Watch for volume increases before major announcements, such as earnings reports, central bank meetings, or geopolitical developments. A surge in volume can signal that higher volatility is expected.
- Use VWAP to gauge the strength of the move and make decisions about whether the trend will continue.
Read More: Trading Chart Patterns: What Are Chart Patterns? + PDF
4. Combining Volume and Volatility for Trading Strategies
By understanding how volume and volatility work together, traders can develop more effective trading strategies. Here’s how to combine both for optimal results:
How It Works:
- Low Volume + Low Volatility: During periods of low volume and low volatility, the market is often in a consolidation phase. There may be no clear trend, and price moves are typically smaller and less predictable.
- High Volume + High Volatility: In these conditions, trends tend to be stronger and more sustained, and price swings are larger. This is when traders can take advantage of breakouts or trend-following strategies.
Why It Matters:
- Low Volume, Low Volatility: Avoid entering highly speculative trades during this period, as there may not be enough market participation to sustain a price move. This is the time to be more selective in your trades.
- High Volume, High Volatility: This is the sweet spot for day traders looking to capitalize on larger price movements. Traders can set wider stop losses and profit targets in these conditions since price swings are more predictable.
Actionable Tip:
- During periods of low volume and low volatility, use tighter stop losses and avoid aggressive trades.
- In high-volume, high-volatility periods, you can afford to take larger positions and set wider stops, as the market is more likely to move in your favor. However, be aware of market news and events that could influence volatility even further.
Conclusion:
- Maximizing Profits with Volume in Day Trading: Volume is a vital tool for day traders because it helps confirm trends, spot reversals, and manage risk. By confirming breakouts, identifying weak moves, and using volume to gauge volatility, traders can make more informed decisions and maximize profits. Always wait for volume confirmation when entering trades to ensure that your positions are supported by sufficient market participation.
- Using Volume and Volatility Together: Volume and volatility go hand in hand—higher volume often signals stronger volatility and trend continuation. When volatility rises with increasing volume, it typically means the market is moving with conviction. Day traders should use this relationship to anticipate significant price swings, manage risk effectively, and enter trades with confidence.
Hi, I’m Asena, a Senior Marketing Specialist with over 8 years of experience and a deep passion for trading knowledge. I have a genuine fascination with the world of Crypto and Forex markets. Over the past 6 years, I’ve dedicated myself to writing about technical analysis, fundamental analysis, and the intricate dynamics of these markets. My mission is to provide the most complete and comprehensive data to empower my audience with actionable insights. I truly love what I do and constantly strive to deliver the best possible results for my readers and users.

Asena Taremi