04 Feb

The Head and Shoulders pattern is a reliable chart pattern used by traders across forex, cryptocurrency, and stock markets. It signals a possible reversal in the prevailing trend and is often used to enter or exit trades with precision.
This article will break down how to identify, trade, and manage risks using the Head and Shoulders pattern.
What is the Head and Shoulders Pattern?
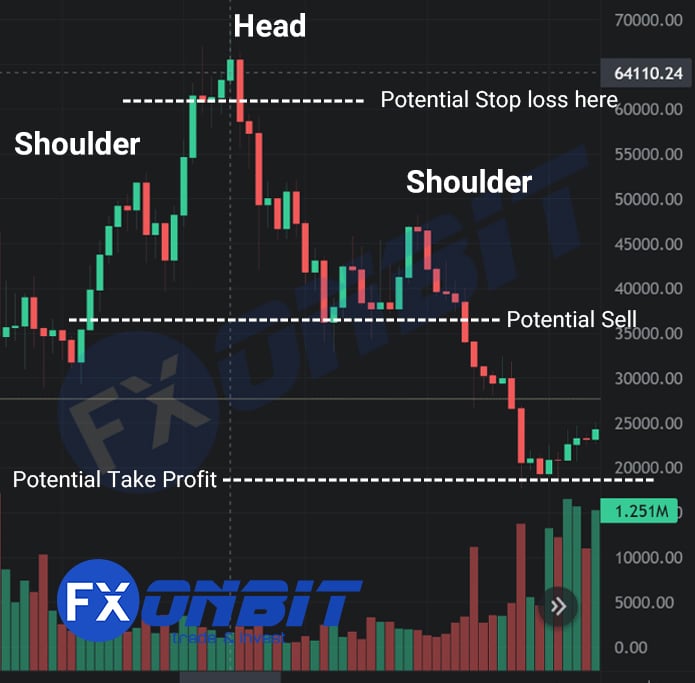
The Head and Shoulders pattern consists of three peaks:
- Left Shoulder: The first peak forms after an upward trend and is followed by a pullback.
- Head: The highest peak forms after the left shoulder and is followed by another pullback.
- Right Shoulder: The final peak forms at a lower height than the head and is followed by a decline.
Connecting the lows between these peaks forms a neckline, which serves as a critical level of support or resistance.
There is also an Inverse Head and Shoulders pattern, which indicates a bullish reversal after a downtrend. The structure is the same but flipped upside down.
Explore more: What is Crypto Screener? The Best Crypto Screener

How to Trade the Head and Shoulders Pattern
- Entry Point: Wait for a confirmed breakout of the neckline. You can enter the trade immediately after the breakout or wait for a retest of the neckline for confirmation. Look for increased volume during the breakout to validate the move.
- Setting Stop Loss:
- For a standard Head and Shoulders, place the stop loss above the right shoulder.
- For an Inverse Head and Shoulders, place the stop loss below the right shoulder.
- Setting Profit Target:
- Measure the distance between the head and the neckline.
- Apply this distance downwards (or upwards for an inverse pattern) from the breakout point to set your profit target.
- Example: If the head is 100 pips above the neckline, aim for a target of 100 pips below it.
💡 Pro Tip: Increased trading volume during the breakout increases the reliability of the pattern in forex markets.
Read more: Crypto Scalp Trading: Basic Guide

Understanding and Identifying the Head and Shoulders Pattern
The Head and Shoulders pattern is one of the most reliable chart formations used by traders to predict potential trend reversals. It signals the exhaustion of an uptrend (or downtrend in the case of an inverse pattern) and the possible start of a new trend in the opposite direction.
Here’s a clearer, step-by-step explanation for traders:
1. Uptrend as the Context
✅ Requirement: The Head and Shoulders pattern is meaningful only when it forms after a sustained uptrend.
💡 Why it matters: The pattern indicates that buying momentum is weakening, and a reversal may be imminent. If there is no prior uptrend, the pattern loses its significance.
Explore more: How to Combine Technical Indicators for More Accurate Trade Signals
2. Left Shoulder: The First Peak
🔹 Formation: The price rises to form a peak (the left shoulder) and then pulls back to a support level.
💡 What to observe: This first peak indicates that buying pressure was strong, but sellers started to push back, creating a small dip.
Explore more: Risk Management in Trading: A Complete Guide for Traders
3. Head: The Highest Peak
🔹 Formation: After the pullback, the price rallies again, reaching a higher peak (the head) before declining again.
💡 Key insight: The head represents the last major effort by buyers to push prices higher. However, if this rally fails to sustain, it could be a sign that buyers are losing control.
Read more: Best Crypto Screener for Trading
4. Right Shoulder: The Lower Peak
🔹 Formation: The price makes another attempt to rise but reaches a peak lower than the head, forming the right shoulder.
💡 What to notice: The right shoulder should ideally be similar in height to the left shoulder, indicating symmetry. This is a sign that the market is unable to regain its previous strength.
5. Neckline: The Key Support Level
🔹 Formation: Draw a line connecting the lows of the pullbacks after the left shoulder and the head. This line is called the neckline.
💡 What to know: The neckline serves as the key support level. A break below the neckline signals that sellers have taken control and a trend reversal is likely.
6. Breakout: Confirmation of the Pattern
🔹 How it happens: When the price breaks below the neckline (for a regular Head and Shoulders pattern), it confirms the pattern.
💡 What to trade:
- ✅ Look for a bearish breakout with strong volume below the neckline for confirmation.
- 📉 Target price: Measure the distance from the top of the head to the neckline and project this downward from the breakout point to set your target.
Read more: FXonbit CandleStick Pattern Finder Service: Your Gateway to Smarter Forex and Crypto Trading
Inverse Head and Shoulders: In the case of a reversal from a downtrend, the same steps apply but in reverse, with the neckline acting as resistance and the breakout occurring to the upside.

Key Trading Tips
✅ Volume: Pay attention to volume. The breakout should ideally occur with increased selling (or buying in an inverse pattern) volume to confirm the pattern.
✅ Stop Loss: Place a stop loss above the right shoulder to limit risk in case of a false breakout.
✅ Retest of Neckline: In many cases, after the breakout, the price may retest the neckline before continuing the reversal trend. This provides a second chance for entry.
Read More: Trading Chart Patterns: What Are Chart Patterns? + PDF
How to Trade the Head and Shoulders Pattern
The Head and Shoulders pattern provides clear guidelines for when to enter, exit, and protect your trade. Let’s break it down with actionable trading steps:
1. Entry Point: Timing the Trade
✅ Step 1: Wait for a confirmed breakout of the neckline.
- A breakout occurs when the price moves below the neckline (for a regular pattern) or above the neckline (for an inverse pattern).
🔹 Two common entry strategies:
💡 Tip: In the forex market, a breakout accompanied by increased volume strengthens the signal. If volume is low, consider waiting for the retest.
2. Setting a Stop Loss: Protecting Your Capital
🔹 Standard Head and Shoulders:
- Place the stop loss above the right shoulder to limit risk if the pattern fails.
🔹 Inverse Head and Shoulders:
💡 Why the right shoulder is key:
If the price breaks beyond the right shoulder, it invalidates the pattern, and exiting the trade early prevents larger losses.
3. Setting a Profit Target: Predicting the Move
✅ Step 1: Measure the distance from the top of the head to the neckline.
- Example: If the head is 100 pips above the neckline, this distance forms the basis of your profit target.
✅ Step 2: Apply this distance downward (for a standard pattern) or upward (for an inverse pattern) from the neckline.
💡 Example:
- Head is 100 pips above the neckline
- After the breakout, set your target 100 pips below the neckline
Explore more: Crypto Grid Trading Strategy Ultimate Guide for Profitable Market Trading

Example Trade: EUR/USD (Standard Head and Shoulders)
- Neckline breakout: The price breaks below the neckline at 1.1000.
- Stop loss: Set at 1.1050 (above the right shoulder).
- Profit target: Measure the distance between the head (1.1150) and the neckline (1.1000) = 150 pips.
- Target: 1.0850 (1.1000 – 150 pips)
Key Trading Tips for Success
✅ Volume confirmation: A spike in volume on the breakout makes the pattern more reliable.
✅ Retest strategy: Many traders prefer waiting for a retest of the neckline for a higher-probability entry.
✅ Partial profit-taking: Consider closing part of your position at key support/resistance levels before reaching the full target.
Practical Example: Head and Shoulders Pattern in Forex
Here’s a step-by-step guide to applying the Head and Shoulders pattern while trading forex, using a common currency pair like EUR/USD as an example:
a. Identify the Pattern
🔹 Look for three peaks on the chart:
- The left shoulder is the first peak.
- The head is the highest peak in the middle.
- The right shoulder forms after the head, lower than the head and often similar to the left shoulder.
💡 Tip: The pattern is typically found after an uptrend, signaling a potential reversal to the downside.
b. Draw the Neckline
✅ Draw a line connecting the lows between the left shoulder and head, and the head and right shoulder. This is called the neckline.
- The neckline can be horizontal or slightly sloped upward or downward.
💡 Tip: The steeper the neckline slope, the more cautious you should be about false breakouts.
c. Wait for the Breakout
🔹 Wait for the price to break and close below the neckline to confirm the pattern.
- A breakout with increased volume indicates higher reliability of the signal.
💡 Tip: Many traders prefer to wait for a close below the neckline instead of entering the trade prematurely.
d. Enter the Trade
✅ Two possible entry strategies:
- Aggressive Entry: Enter a short (sell) position as soon as the price breaks and closes below the neckline.
- Conservative Entry: Wait for the price to retest the neckline as resistance and then enter the short position.
💡 Why wait for the retest? It reduces the chance of entering on a false breakout.
e. Set Stop Loss and Take Profit
🔹 Stop Loss: Place the stop loss above the right shoulder to protect against unexpected price movements.
🔹 Take Profit: Measure the distance between the head and the neckline and project this distance downwards from the breakout point.
💡 Example Calculation:
- If the head is 150 pips above the neckline, set the profit target 150 pips below the neckline.
- For example:
- Neckline = 1.1000
- Head = 1.1150
- Profit target = 1.0850 (1.1000 – 150 pips)

Managing Risk and Avoiding False Breakouts in Head and Shoulders Trading
To trade the Head and Shoulders pattern successfully, managing risk and avoiding false breakouts is crucial. Here’s how you can enhance your trading strategy:
1. Use Volume Indicators
🔹 Why it matters: A genuine breakout is typically accompanied by increased trading volume.
✅ What to do: Monitor volume during the breakout of the neckline.
- If the breakout occurs with low volume, it could be a sign of a false breakout.
- If volume spikes, it often indicates strong conviction from sellers (or buyers in an inverse pattern).
💡 Tip: Forex traders can use tools like the On-Balance Volume (OBV) or Volume Oscillator to assess whether the breakout is backed by strong market activity.
Explore more: Symmetrical Triangle Pattern: A Powerful Price Action Signal
2. Combine with Other Indicators
🔹 Why it helps: Other indicators can provide additional confirmation of a potential trend reversal or continuation.
✅ Indicators to consider:
- RSI (Relative Strength Index): Look for overbought conditions during the right shoulder to confirm a potential bearish reversal.
- MACD (Moving Average Convergence Divergence): Check for bearish crossovers or divergences to confirm the weakness in the uptrend.
💡 Example: If the RSI is above 70 (overbought) during the right shoulder, and MACD shows a bearish crossover, it strengthens the case for a sell.
3. Retest Confirmation
🔹 Why it’s important: False breakouts often occur when the price breaks the neckline but quickly reverses. Waiting for a retest of the neckline can improve your chances of success.
✅ How to do it:
- After the price breaks below the neckline, wait for it to retest the neckline as resistance (or support for an inverse pattern).
- Enter the trade only if the price fails to break back above the neckline and resumes its movement in the direction of the breakout.
💡 Tip: A successful retest often comes with a rejection candle (e.g., a bearish pin bar or engulfing candle).
Additional Risk-Management Tips
- Position Sizing: Limit your risk by risking only a small percentage of your trading capital (e.g., 1-2%) on any single trade.
- Trailing Stop Loss: Consider using a trailing stop to lock in profits as the price moves in your favor while protecting against reversals.
- Diversification: Avoid relying solely on one chart pattern. Combine Head and Shoulders with other market analysis techniques to improve accuracy.
Read more: How to Customize Crypto Screener to Match Your Trading Strategy

Common Mistakes to Avoid
- Entering Too Early: Wait for the neckline breakout confirmation.
- Ignoring Volume: Low volume breakouts are prone to failure.
- Forgetting Risk Management: Always set stop losses and follow proper position sizing.
Final Thoughts
The Head and Shoulders pattern is a powerful tool when used correctly. However, it should be combined with other forms of technical analysis to increase its effectiveness. Practice identifying and trading this pattern on demo accounts before applying it to live markets. With time and discipline, the Head and Shoulders pattern can become a reliable part of your trading strategy.
By mastering this pattern, traders can improve their ability to identify trend reversals and take advantage of high-probability trading setups.
Read more: What is Crypto Whale Tracker? How FXonbit Empowers You to Follow Market Giants
Hi, I’m Asena, a Senior Marketing Specialist with over 8 years of experience and a deep passion for trading knowledge. I have a genuine fascination with the world of Crypto and Forex markets. Over the past 6 years, I’ve dedicated myself to writing about technical analysis, fundamental analysis, and the intricate dynamics of these markets. My mission is to provide the most complete and comprehensive data to empower my audience with actionable insights. I truly love what I do and constantly strive to deliver the best possible results for my readers and users.

Asena Taremi