12 Feb

The Moving Average Convergence Divergence (MACD) indicator is one of the most popular tools used in technical analysis. It helps traders identify trends, momentum, and potential reversals in price movements. A key concept within MACD analysis is MACD divergence, which can signal potential trend reversals and trading opportunities.
Start Our Crypto & Forex Screener Dashboard For Free
In this article, we will cover:
- What is MACD Divergence?
- How Does MACD Work?
- Types of MACD Divergence
- How to Spot MACD Divergence
- When to Use It
- Why MACD Divergence Matters
- How to Trade Using MACD Divergence
- Additional Tips for Maximizing MACD Signals
What Is MACD Divergence?
MACD divergence happens when the price movement and the MACD indicator show opposite directions. This signals that the trend’s strength is weakening and that a possible reversal could occur.
If the price keeps making new highs while the MACD makes lower highs, it indicates bearish divergence, suggesting that the upward momentum is fading. On the other hand, if the price makes new lows while the MACD forms higher lows, it indicates bullish divergence, meaning that downward momentum is slowing and a potential upward reversal may happen.
Traders use MACD divergence to confirm trade signals, spot trend exhaustion, and find high-probability entry and exit points in the market.
MACD divergence is a powerful tool for detecting weakening trends and potential reversals. However, it should be used with other technical analysis techniques to maximize accuracy.
Explore more: Risk Management in Trading: A Complete Guide for Traders

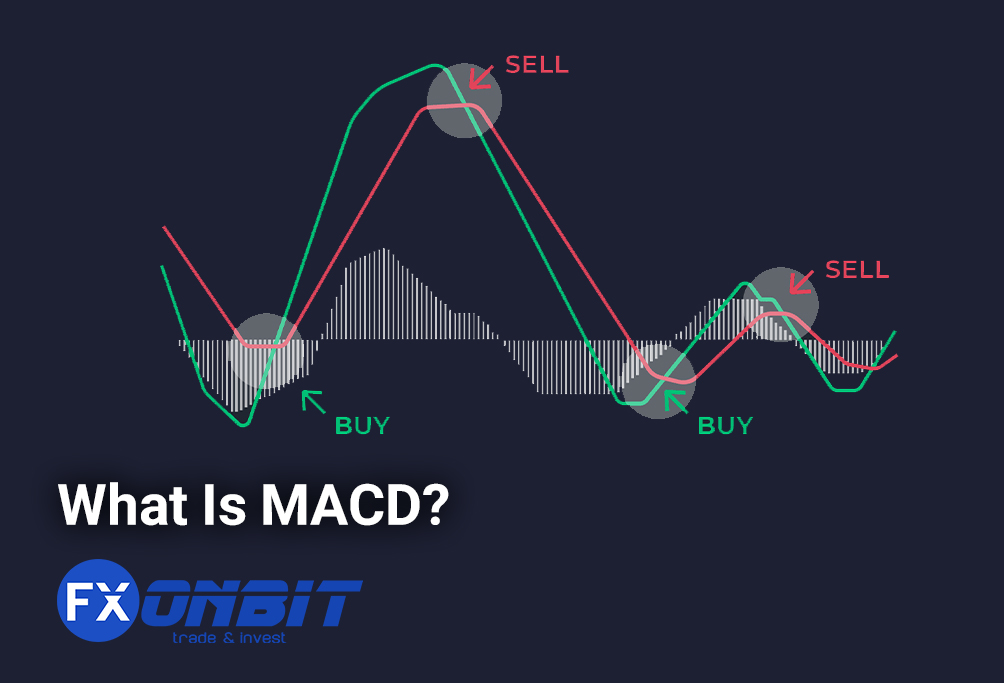
How Does MACD Work?
The MACD indicator consists of three main components:
- MACD Line – The difference between the 12-period Exponential Moving Average (EMA) and the 26-period EMA.
- Signal Line – A 9-period EMA of the MACD line, used to generate buy and sell signals.
- Histogram – The graphical representation of the difference between the MACD line and the signal line.
Key MACD Signals:
- When the MACD line crosses above the signal line, it indicates bullish momentum.
- When the MACD line crosses below the signal line, it suggests bearish momentum.
- The histogram bars expand when the trend strengthens and contract when momentum weakens.
Explore more: Simple Moving Average (SMA)

Types of MACD Divergence
There are two main types of MACD divergence:
1. Bullish Divergence (Positive Divergence)
Occurs when:
- The price forms lower lows, but
- The MACD indicator forms higher lows.
🔹 Implication: This suggests that downward momentum is weakening, and a bullish reversal may occur.
Example: If Bitcoin is forming new lows while the MACD histogram and line are trending higher, it may signal a buy opportunity.
Read this: The Best Martingale Strategy for Trading
2. Bearish Divergence (Negative Divergence)
Occurs when:
- The price forms higher highs, but
- The MACD indicator forms lower highs.
🔹 Implication: This indicates that upward momentum is weakening, and a bearish reversal may occur.
Example: If Ethereum is making new highs while the MACD line is forming lower highs, it may signal a sell opportunity.
Read more: Best Crypto Screener for Trading
How to Spot MACD Divergence
To effectively identify MACD divergence:
- Examine the price action – Identify the highs and lows.
- Check the MACD indicator – Look for a discrepancy between price action and the MACD line.
- Analyze the histogram – Observe whether it confirms the divergence.
- Use additional indicators – RSI or volume analysis can add confirmation.
🔹 Pro Tip: The higher the timeframe (such as 1-hour, 4-hour, or daily), the more reliable the divergence signal.
Read more: Advanced Ichimoku Cloud Trading Strategies
How to Trade MACD Divergence Effectively
MACD divergence is a powerful tool for identifying potential trend reversals, but using it effectively requires understanding confirmation signals, entry points, and risk management. Here’s how to trade better with MACD divergence:
1. Confirming MACD Divergence Before Entering a Trade
Not all divergences lead to immediate reversals. To increase accuracy, traders should confirm divergence using:
- Price Action: Look for support/resistance levels, trendline breaks, or candlestick patterns (e.g., bullish engulfing for bullish divergence, bearish engulfing for bearish divergence).
- Volume Analysis: A decrease in volume on higher highs (for bearish divergence) or lower lows (for bullish divergence) strengthens the signal.
- Other Indicators: RSI, Stochastic, or trendlines can reinforce the validity of a divergence setup.
Explore more: How to Combine Technical Indicators for More Accurate Trade Signals
2. Trading Bullish Divergence
Entry:
- Identify a bullish divergence (lower lows in price but higher lows in MACD).
- Wait for a MACD crossover (when the MACD line crosses above the signal line) as confirmation.
- Enter a buy trade once price shows bullish momentum (e.g., breaking a trendline or a resistance level).
Stop-Loss Placement:
- Below the recent swing low or a strong support zone.
Profit Target:
- Use Fibonacci retracement levels, moving averages, or previous resistance levels as targets.
Read more: Weighted Moving Average (WMA): A Comprehensive Guide for Traders

3. Trading Bearish Divergence
Entry:
- Identify a bearish divergence (higher highs in price but lower highs in MACD).
- Wait for a MACD crossover (when the MACD line crosses below the signal line) as confirmation.
- Enter a sell trade once price confirms bearish momentum (e.g., breaking below support or forming a bearish candlestick pattern).
Stop-Loss Placement:
- Above the recent swing high or a key resistance level.
Profit Target:
- Look for previous support levels or use Fibonacci extensions to set exit points.
4. Avoiding False Divergences
- Strong Trends Can Continue: Sometimes, divergence appears, but the trend continues. Always wait for confirmation.
- Combine with Market Context: Consider macroeconomic factors, news, and fundamental analysis.
- Use Higher Timeframes: Divergence signals on larger timeframes (e.g., 4H, daily) are more reliable than those on smaller timeframes.
Read more: Price Action Trading: The Art of Trading Without Indicators
5. Practical Example:
Bullish Divergence on BTC/USD (Hypothetical)
- Price drops from $40,000 to $38,000.
- MACD makes a higher low while price makes a lower low.
- A MACD crossover confirms momentum shift.
- Entry: Buy at $38,200 after breakout of resistance.
- Stop-loss: Set at $37,500 (below recent swing low).
- Take-profit: Target $40,500 (previous resistance level).
Final Tips
✅ Always wait for confirmation before entering trades.
✅ Use stop-losses to protect against fake signals.
✅ Combine divergence with other tools like trendlines, moving averages, or RSI for higher accuracy.
✅ Focus on higher timeframes for stronger signals.

When to Use MACD Divergence?
MACD divergence is most effective in the following situations:
✅ Trend Reversals – Best used in extreme overbought or oversold conditions to predict reversals.
✅ Volatile Markets – Works well in assets like cryptocurrencies, forex, and stocks where momentum shifts frequently.
✅ Swing Trading – Traders use MACD divergence to identify trade setups for medium-term positions.
❌ Avoid Using in Ranging Markets – In sideways markets, MACD divergence can generate false signals.
Why MACD Divergence Matters in Trading
MACD divergence is a crucial tool for traders because it helps detect early trend reversals, improve trade timing, and enhance overall strategy accuracy. Here’s why it’s important:
1. Early Reversal Signals
🔹 Why it matters: MACD divergence signals a potential trend shift before it happens, allowing traders to prepare for reversals in advance.
🔹 How to use it: When divergence appears, monitor price action for confirmation (e.g., MACD crossover or trendline break) before entering a trade.
2. Better Trade Entry & Exit
🔹 Why it matters: It helps identify optimal buy and sell points, reducing the risk of entering too late or exiting too soon.
🔹 How to use it:
- Bullish Divergence: Buy when MACD confirms with a crossover or price breaks resistance.
- Bearish Divergence: Sell when MACD crosses down or price breaks support.
3. Works in Various Markets
🔹 Why it matters: MACD divergence is versatile and works across crypto, forex, stocks, and commodities.
🔹 How to use it:
- In crypto (e.g., Bitcoin, Ethereum), it helps spot trend exhaustion before major moves.
- In forex, it’s effective for swing trading and day trading.
- In stocks, it helps detect shifts in momentum before earnings releases or market trends.
4. Enhances Trading Strategies
🔹 Why it matters: It strengthens technical analysis when combined with other indicators.
🔹 How to use it:
- RSI (Relative Strength Index): Confirms overbought/oversold conditions with divergence.
- Fibonacci Retracement: Identifies potential reversal zones when divergence aligns with key levels.
- Moving Averages: Helps confirm overall trend direction.
Explore more: Understanding Volume in Trading: A Beginner’s Guide

How to Trade Using MACD Divergence
Step 1: Identify Divergence
Look for discrepancies between price action and the MACD indicator.
Step 2: Confirm with Other Indicators
Use tools like:
- RSI (Relative Strength Index) – Confirms overbought/oversold conditions.
- Volume Analysis – High volume supports a stronger reversal.
Step 3: Enter the Trade
- For Bullish Divergence: Enter a buy position when price confirms a reversal.
- For Bearish Divergence: Enter a sell position when price starts to decline.
Step 4: Set Stop-Loss and Take Profit
- Place a stop-loss below/above the recent swing low/high.
- Use a risk-reward ratio of at least 1:2 or 1:3.
Step 5: Exit Strategy
- Consider exiting at key resistance/support levels.
- If the MACD re-aligns with price, consider closing the trade.
Additional Tips for Maximizing MACD Divergence Signals
💡 Combine with Other Indicators – Pair MACD with Bollinger Bands, RSI, or trendlines for stronger confirmation.
💡 Trade on Higher Timeframes – More reliable signals appear on 4-hour, daily, or weekly charts.
💡 Be Patient – False signals can occur, so wait for clear confirmations.
💡 Avoid Weak Divergences – If the divergence is too small, it may not be a strong signal.
💡 Use Backtesting – Practice identifying MACD divergence on historical data before trading live.
For any questions or feedback, feel free to reach out to us! You can contact us via email at [email protected] or connect with us on Telegram, Twitter, or Discord. We’re here to help! 🚀
Final Thoughts
MACD divergence is a powerful tool for traders looking to spot trend reversals and enter high-probability trades. By understanding how to identify and trade MACD divergence effectively, traders can enhance their technical analysis skills and improve their profitability.
📌 Key Takeaways:
- MACD divergence signals potential trend reversals.
- Bullish divergence suggests a buy opportunity, while bearish divergence suggests a sell opportunity.
- Confirm divergence with other indicators like RSI, Fibonacci, or volume analysis.
- Trade with a risk management strategy to minimize losses.
By mastering MACD divergence, you can make smarter, more informed trading decisions in the crypto, forex, and stock markets.

Hi, I’m Asena, a Senior Marketing Specialist with over 8 years of experience and a deep passion for trading knowledge. I have a genuine fascination with the world of Crypto and Forex markets. Over the past 6 years, I’ve dedicated myself to writing about technical analysis, fundamental analysis, and the intricate dynamics of these markets. My mission is to provide the most complete and comprehensive data to empower my audience with actionable insights. I truly love what I do and constantly strive to deliver the best possible results for my readers and users.


Asena Taremi