06 Mar

Price action trading is the ninja art of slicing through market chaos, zeroing in on raw price moves without the clutter of fancy indicators. It’s all about reading the market’s pulse—cracking the code of candlestick twists, support and resistance battlegrounds, trendline trails, and chart blueprints. Master this, and you’re not just guessing; you’re dancing with real-time market vibes, leaving lagging gadgets in the dust.
Start Our Crypto & Forex Dashboard For Free
In this epic guide, we’re diving headfirst into the heart of price action trading. We’ll unravel its core secrets, spotlight must-know candlestick patterns, arm you with killer strategies, and show you how to wield them like a pro in the wild arenas of Forex and crypto. Get ready to trade with eyes wide open and adrenaline pumping!
Explore more: What is Crypto Screener? The Best Crypto Screener

Understanding Price Action Trading
Price action trading is your ticket to reading the market like a seasoned pro—zeroing in on historical price moves to call the shots on what’s coming next. No lagging indicators or fancy formulas here; this is about getting down and dirty with raw price data. You’re sizing up market sentiment, nailing trends, and spotting reversals—all from the tape, no crutches needed.
Explore more: How to Combine Technical Indicators for More Accurate Trade Signals
Why Trade with Price Action?
Here’s the edge price action delivers—straight-up, no-BS reasons to ditch the clutter and trade like a boss:
- Kills Indicator Lag: Indicators are yesterday’s news—sloppy seconds derived from price. Price action? That’s real-time intel, straight from the source. You’re in the driver’s seat, not chasing tail lights.
- Clean Charts, Clear Wins: Forget the mess of overlapping lines and oscillators. Price action keeps it tight—uncluttered charts where trends scream and levels pop. Less noise, more profit.
- Works Every Market: Forex, stocks, commodities, crypto—this bad boy doesn’t care. Price action’s universal, giving you the same edge whether you’re scalping pips or riding BTC pumps.
- Sharpens Your Game: Once you decode price moves, you’re not just reacting—you’re ahead of the pack. It’s raw market smarts, turning you into a decision-making machine ready to capitalize.
This is Price Action Trading stripped to its core—fast, fierce, and in your control. Price action’s where the big dogs play. You in?
Explore more: Crypto Whale Tracker Guide: How to Follow the Biggest Players in the Market
Key Concepts of Price Action Trading
Price action trading is all about mastering the battlefield—knowing where price is gonna bounce, break, or fake you out.
These core concepts are your weapons: Support and Resistance Levels, Trendlines and Market Structure, and Candlestick Patterns. Let’s break them down so you can trade with the precision of a sniper.
Explore more: Risk Management in Trading: A Complete Guide for Traders
Support and Resistance Levels
Support and resistance are the market’s invisible walls—price levels where the action heats up and traders make their stand.
- Support: This is the floor where buyers swarm in, saying, “No more selling!” It’s a price zone where demand kicks in hard enough to halt a drop. Think of it as a trampoline—price hits it and bounces. For example, if EUR/USD keeps rejecting $1.0500, that’s your support—buyers are defending it like a fortress.
- Resistance: The ceiling where sellers pile on, yelling, “Enough climbing!” It’s where supply overwhelms demand, capping the rally. If BTC/USD stalls at $70,000 three times, that’s resistance—sellers are unloading bags, and price struggles to punch through.
Price Action Trading Edge: These aren’t just lines—they’re psychological war zones. Traders watch them for reversals (price bounces off) or breakouts (price smashes through). A support level that holds three times is gold—load up longs with a stop below. If resistance breaks with volume, ride the breakout, targeting the next big level (e.g., $71,000 after $70,000 cracks). Watch for role reversal: broken support becomes resistance, and vice versa—test it on a 4-hour chart and see the magic.
Read this: The Best Martingale Strategy for Trading
Trendlines and Market Structure
Trendlines are your compass—they map the market’s direction so you’re not trading blind.
- Uptrend: Price carves higher highs and higher lows—a staircase to the moon. Draw a line connecting those lows (e.g., $50, $52, $54), and you’ve got your trendline. It’s where buyers step in on pullbacks. Think XAU/USD climbing from $2,000 to $2,100—ride the dips, stop below the line.
- Downtrend: Flip it—lower highs and lower lows. Connect the highs (e.g., $60, $58, $56), and that’s your sell zone. Sellers dominate, pounding price down. Short those bounces, stop above the trendline.
- Sideways Trend: Price ping-pongs in a range—no clear winner. Draw horizontal lines at the top (resistance) and bottom (support)—say, $100 to $105. Scalp the edges or wait for a breakout.
Price Action Trading Edge: A trendline break is your signal—market structure’s shifting. In an uptrend, if price cracks below the trendline and makes a lower low (e.g., $53 after $54), the bulls are toast—go short. In a downtrend, a higher high above the line flips it bullish. Use volume to confirm: a weak break’s a trap, a strong one’s your ticket. Pair with a 20-period MA—if price hugs it in a trend, you’re golden; if it diverges, brace for a shift.
Explore more: Advanced Technical Analysis: Using Divergences and Convergences for Precision Trading
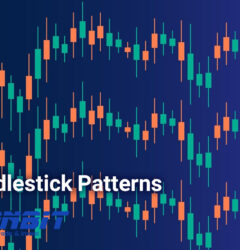
Candlestick Patterns
Candlesticks are the market’s heartbeat—each one spills the tea on who’s winning: buyers or sellers. These patterns are your cheat codes for timing entries and exits.
Reversal Patterns
- Pin Bar (Hammer & Shooting Star): These are sniper shots signaling a trend’s about to flip. A hammer—small body, long lower wick—shows buyers rejecting a drop (e.g., USD/JPY hits 150.00, wicks down to 149.80, closes at 149.95). Go long above the high, stop below the wick. A shooting star—long upper wick—shows sellers smacking price down after a rally (e.g., ETH/USD tags $3,000, rejects to $2,980). Short below the low, stop above the wick.
- Engulfing Candles: Big, bold, and badass. A bullish engulfing—a green candle swallowing the prior red one—screams buyers are back (e.g., after a dip to $1.2000 on GBP/USD, next candle blasts to $1.2050). Enter long, target the next resistance. A bearish engulfing—red eating green—means sellers are flexing (e.g., SPX tops at 5,000, drops to 4,980). Short it, aim for support.
- Doji: The market’s shrug—tiny body, wicks on both ends. It’s indecision city, often at peaks or troughs (e.g., XRP/USD at $0.50 after a run). Alone, it’s a heads-up; with a trendline break or engulfing follow-up, it’s a reversal trigger. Trade the next candle’s direction.
Read more: Price Action Trading: The Art of Trading Without Indicators
Continuation Patterns
- Inside Bar: A tiny candle nesting inside the prior one’s range—a coiled spring. After a $20 move on Crude Oil to $80, an inside bar at $79.80-$80 signals a pause. Breakout above $80? Long to $85 (prior move’s height). Below $79.80? Short to $75. Tight stops, big rewards.
- Three Soldiers/Three Crows: Trend fuel. Three White Soldiers—three green candles marching up (e.g., AUD/USD from $0.6500 to $0.6550)—say the bulls are locked in. Join the ride, stop below the first soldier. Three Black Crows—three red candles dropping (e.g., Nasdaq from 18,000 to 17,900)—mean bears are feasting. Short it, stop above the first crow.
Price Action Trading Edge: Candlesticks need context—random hammers don’t cut it. Pin bars at support/resistance are dynamite; engulfings after a trend stall are money. Dojis? Wait for confirmation—next candle’s your green light. Inside bars love volatility—trade them post-news or big moves. Three Soldiers/Crows shine on higher timeframes (4H, daily)—lower noise, bigger wins. Backtest these on Forex pairs like USD/CAD or crypto like SOL/USD—patterns repeat like clockwork.
Read more: Best Crypto Screener for Trading
Pro Tips for Traders
- Combine Concepts: A pin bar at support with a trendline bounce? That’s a triple-threat entry. Stack your signals for higher odds.
- Volume Check: Breakouts or reversals with weak volume are suspect—wait for the juice to flow.
- Timeframes Matter: Scalp on 5M with inside bars; swing on 1D with engulfings. Match your style.
- Risk It Right: Stops below wicks or ranges, targets at key levels—keep that 1:2 ratio locked.
These concepts aren’t just theory—they’re your playbook. Test them live, tweak your setups, and watch price action turn chaos into cash.
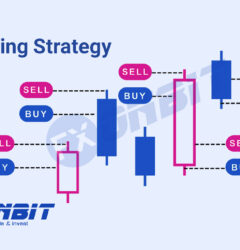
Price Action Trading Strategies
1. Trend Trading with Price Action
Steps:
- Identify the trend: Start by identifying the trend on the chart. For an uptrend, look for higher highs and higher lows. For a downtrend, look for lower highs and lower lows. This is the foundation of your analysis.
- Wait for a retracement: Once you’ve identified the trend, wait for the price to pull back (retrace) to a support level (in an uptrend) or resistance level (in a downtrend). A retracement allows you to enter the market at a more favorable price.
- Enter on candlestick confirmation: Look for a strong candlestick formation, such as an engulfing candle, a pin bar, or a breakout candle. These candlestick patterns provide confirmation of a reversal or continuation in the direction of the trend.
- Place stop loss: Place your stop loss just below the most recent swing low (for an uptrend) or above the most recent swing high (for a downtrend). This ensures you limit your risk if the trade goes against you.
- Take profit: Your take-profit target should be at the next key resistance (in an uptrend) or support (in a downtrend). This is where price is likely to encounter resistance or find support, which could reverse the trend again.
Read more: Weighted Moving Average (WMA): A Comprehensive Guide for Traders
2. Support and Resistance Price Action Trading
Steps:
- Mark key zones: Identify and mark key support and resistance levels on your chart. These are horizontal lines where price has previously reversed or stalled, making them important price points to monitor.
- Wait for price rejection: Look for signs of price rejection at these zones. You can identify this by looking for candlestick patterns like pin bars (which show rejection) or engulfing candles (which indicate a strong reversal). A rejection means that price is having difficulty breaking through the level.
- Enter the trade: Once you see the price rejection, enter the trade in the direction of the rejection. For example, if price rejects a resistance level in an uptrend, it suggests the price will go lower, so you would enter a short position.
- Set stop loss: Place your stop loss just beyond the support or resistance level. For example, if you’re trading a support level, place your stop loss slightly below it to account for possible price fluctuations.
- Take profit: Set your take profit at the next significant support or resistance level. This ensures you lock in profits before price reaches another area that might reverse the trend.
3. Breakout Price Action Trading Strategy
Steps:
- Identify key levels: Identify key support and resistance levels where price has historically reversed. These levels often create a “range” where price bounces between highs and lows, creating a base for a potential breakout.
- Wait for a breakout: A breakout happens when price breaks through these levels with strong momentum. This could be a sharp price move followed by a high volume, signaling that the market is shifting.
- Enter on retest: After the breakout, wait for a retest of the breakout level. This is when the price returns to the breakout point (support turning into resistance or vice versa). A retest confirms the breakout and provides a safer entry point.
- Place stop loss: Place your stop loss just below the breakout level if it’s a long trade or above it if you’re shorting the market. This ensures you’re protected if the breakout proves to be false.
- Take profit: Set your take profit at the next support or resistance level where price is likely to face opposition and might reverse.
Read More: Trading Chart Patterns: What Are Chart Patterns? + PDF
4. False Breakout Strategy
Steps:
- Identify strong levels: Just like in the breakout strategy, start by identifying strong support and resistance levels. These are the price points where price has previously reversed, so they’re likely to be key areas for future price action.
- Wait for a breakout: Wait for price to break through one of these levels. However, unlike a typical breakout strategy, you’re now looking for a false breakout, where price moves beyond the key level but quickly reverses.
- Look for reversal confirmation: Once the price breaks out, wait for a candlestick pattern like a pin bar or engulfing candle that signals a reversal. These patterns tell you that the market has failed to sustain the breakout and is likely to move in the opposite direction.
- Enter the trade: Enter a trade in the opposite direction of the breakout. The false breakout traps traders who entered thinking the price would continue in the breakout direction, and you can take advantage of the reversal.
- Place stop loss: Your stop loss should be placed above (for a short position) or below (for a long position) the breakout level. This ensures you limit your risk if the market continues in the breakout direction.
- Take profit: Your take-profit target should be at the previous support or resistance level. This is the level where price might reverse again or at a point where the market structure changes.
Read more: What is Crypto Whale Tracker? How FXonbit Empowers You to Follow Market Giants
Practical Tips for Trading with Price Action
Price action trading isn’t just about spotting patterns—it’s about executing like a pro in the heat of the market. These battle-tested tips will sharpen your edge, keep your account alive, and turn raw price moves into consistent wins. Let’s dive in and get you trading like the big dogs.
- Use Multiple Time Frames
Zoom out, then zoom in—multiple time frames are your secret weapon. Higher time frames like the daily or 4-hour are where the real juice lives—think rock-solid support levels or trendline breaks that actually stick. A pin bar on the daily at $1.2000 on EUR/USD? That’s a signal with teeth, backed by institutional muscle. Lower time frames—15-minute or 1-hour—are faster but noisier, better for scalping inside bars or quick breakouts (e.g., BTC/USD wicking $60,000 on 15M).
Pro Move: Start with the daily to map the big picture—trend direction, key levels—then drop to 1H or 15M to time your entry. A bullish engulfing on the 4H at support, confirmed by a 15M breakout? That’s your green light. Test it on XAU/USD—daily shows the trend, 1H nails the trigger.
- Combine Price Action with Market Context
Price doesn’t move in a vacuum—context is king. News bombs like NFP or Fed rate hikes can flip charts upside down, so check the calendar before you trade. A doji at resistance looks sweet, but if a rate cut’s dropping, that breakout might rocket past $1.3000 on GBP/USD. Trend strength matters too—ADX above 25 says the trend’s got legs; below 20, and you’re stuck in chop. Overall market conditions—bullish risk-on vibes or bearish flight-to-safety—set the stage. Crypto pumping while stocks tank? That’s your cue to lean long on ETH/USD.
Pro Move: Pair price action with a quick scan: trending or ranging? News incoming? A hammer at $2,000 on gold during a risk-off USD spike is a fade—sellers are lurking. But in a trending market with quiet news, ride that breakout. Backtest USD/JPY during BOJ announcements—context turns good trades into great ones.
- Risk Management is Key
No risk management, no account—it’s that simple. Every trade needs a stop-loss, period. Pin bar at $50 on SPY? Stop below the wick at $49.50—don’t guess, let price tell you. Aim for a 1:2 risk-reward ratio minimum: risk $1 to make $2. If your stop’s $0.0050 on AUD/USD at $0.6500, target $0.6600—next resistance or pattern projection. Size your position right—1% account risk max per trade keeps you in the game when the market punches back.
Pro Move: Use ATR to set stops—1x ATR below a level adds breathing room (e.g., $10 on Nasdaq if ATR’s $10). Trail stops on winners—lock in half your target, let the rest ride. A $100 move on Crude Oil? Secure $50, chase $150 if it runs. Risk is your lifeline—respect it.
- Practice Before Trading Live
Don’t blow your stack learning the hard way—demo accounts are your training ground. Grind out 50 trades on Forex.com’s simulator: test pin bars on USD/CAD, engulfings on NZD/JPY, trendline breaks on BTC/USD. Tweak your setups—does a 4H doji with volume beat a 1H one? Log your wins, losses, and “why”—patterns emerge fast. Demo trading builds muscle memory without the pain of a margin call.
Pro Move: Treat demo like real money—same sizes, same rules. Hit 70% win rate on 20 trades with a 1:2 ratio? You’re ready. Mess up a breakout on EUR/GBP? Replay it—see where price faked you out. Demo’s your lab; live’s the battlefield.
- Keep Emotions in Check
Fear and greed are account killers—stick to your damn plan. You’ve got a setup: inside bar at $0.7000 on AUD/USD, stop at $0.6980, target $0.7040. Price wicks to $0.6990—don’t panic and bail early. Market rips to $0.7060 without you? Don’t FOMO in late. Emotions turn winners into losers faster than a bad stop. Write your rules—entry, exit, risk—and tape them to your screen if you have to.
Pro Move: Use a checklist: “Level hit? Volume up? Stop set?” Check, check, check—then pull the trigger. Journal every trade—“Greed made me chase” or “Fear cut it short” shows your leaks. Meditate, punch a bag, whatever—stay ice-cold when the candles dance.
- Putting It All Together
Here’s a live play: USD/JPY on the daily shows a hammer at 148.00—support from last month. 1H zooms in: breakout above 148.50, volume spikes. News? Quiet day, trend’s up (50-day MA rising). Risk $50 (stop at 147.75, 1% of $5,000 account), target 150.00—$150 profit, 1:3 ratio. Demo’d this setup 10 times, 7 wins. Emotions? Locked down—plan says go, I go. That’s price action trading—calculated, ruthless, profitable.
Final Edge: Stack these tips—multi-frame confirmation, context awareness, tight risk, demo reps, and steel nerves. Test it on GBP/USD or ETH/USD live charts. Price action’s your edge; these habits make it a weapon. Now go hunt those pips.
Read more: Advanced Ichimoku Cloud Trading Strategies
Conclusion
Price action trading is a skill that requires patience and practice, but once mastered, it provides a clear and effective way to navigate the markets without relying on lagging indicators. By understanding support and resistance, candlestick patterns, and trend structures, traders can gain an edge and make well-informed trading decisions.
If you’re looking to enhance your trading skills, start analyzing price action on your favorite markets today, apply the strategies mentioned, and refine your approach through continuous learning and practice.
Hi, I’m Asena, a Senior Marketing Specialist with over 8 years of experience and a deep passion for trading knowledge. I have a genuine fascination with the world of Crypto and Forex markets. Over the past 6 years, I’ve dedicated myself to writing about technical analysis, fundamental analysis, and the intricate dynamics of these markets. My mission is to provide the most complete and comprehensive data to empower my audience with actionable insights. I truly love what I do and constantly strive to deliver the best possible results for my readers and users.

Asena Taremi