06 Mar
Tired of whiffing trades because one indicator keeps feeding you duds? Single-indicator plays are a gamble—false signals and choppy markets can bleed you dry. The pros know the trick: stack multiple technical indicators to lock in razor-sharp signals that actually cash out. This guide breaks down killer combos with specific examples, perfect for juicing up your crypto and forex game—whether you’re riding BTC pumps or scalping EUR/USD. Let’s get you winning.
Start Our Free Crypto & Forex Dashboard
Decoding Technical Indicators—Your Trading Arsenal
Indicators are your market X-ray, crunching price, volume, and action into signals that scream “go” or “hold.” Here’s the crew:
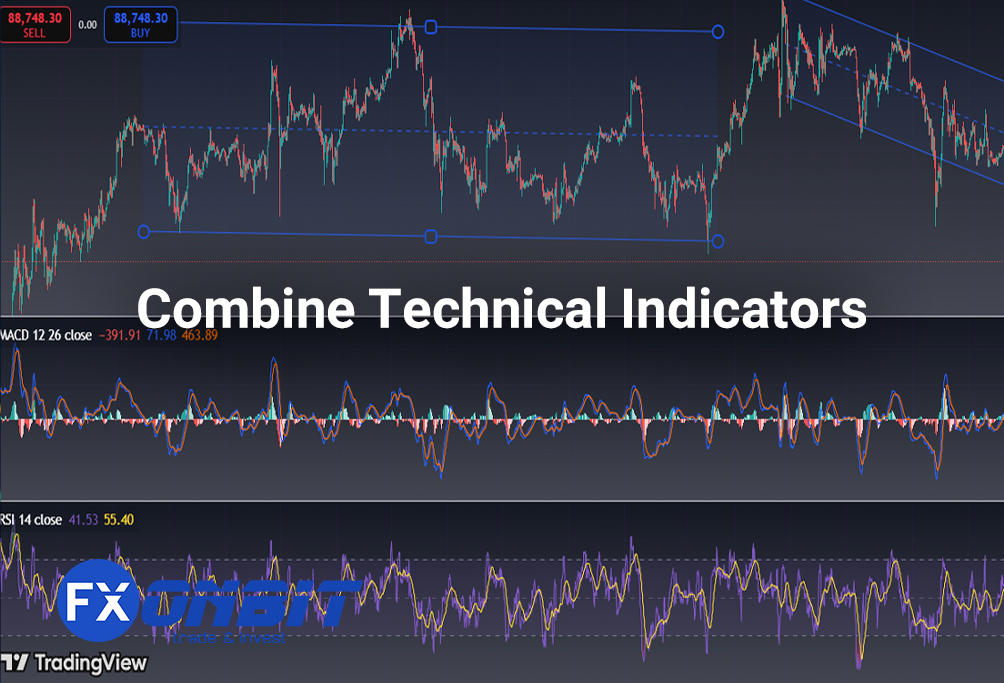
- Trend-Chasers: Moving Averages (MA), MACD, Ichimoku Cloud—ride the wave, don’t fight it.
- Momentum Kings: RSI, Stochastic Oscillator, MACD—time the rockets and dodge the fizzles.
- Volatility Scouts: Bollinger Bands, ATR—know when it’s calm before the storm.
- Volume Powerhouses: OBV, Accumulation/Distribution, Chaikin Money Flow—follow the big money’s footprints.
Solo, they’re decent. Together? Unstoppable. Here’s how to mix ‘em for signals your AI bots and screeners can feast on.
Specific Indicator Combos That Crush It
These aren’t theories—they’re battle-tested setups. Plug them into your robots or screeners and watch the magic.
What’s a Combo?
A combo is a strategy where you use multiple technical indicators—each with its own focus (trend, momentum, volatility, volume)—and only act when they agree on a trade setup. Instead of betting on one indicator’s hunch (which can flake out in choppy markets), you wait for a double (or triple) confirmation. It’s like cross-checking your intel before pulling the trigger.
For example:
- One indicator might say, “The trend’s up!”
- Another might add, “Momentum’s kicking in!”
- Together, they scream, “Buy now—this is legit!”
This synergy cuts the guesswork, making your AI bots sharper and your screeners deadlier at spotting winners.
Combo 1: SMA + RSI (Trend + Momentum)
- Setup:
- 50-day Simple Moving Average (SMA): Confirms the trend—price above = uptrend, below = downtrend.
- Relative Strength Index (RSI, 14-period): Measures momentum—below 30 = oversold (buy), above 70 = overbought (sell).
- Signal:
- Buy: Price crosses above 50-SMA and RSI dips below 30 then climbs back (e.g., BTC at $60k after a dip).
- Sell: Price drops below 50-SMA and RSI tops 70 then falls (e.g., ETH overstretched at $4k).
- Why It Works: SMA filters the trend so RSI doesn’t fake you out in chop. Perfect for crypto swings or forex breakouts.
Combo 2: Bollinger Bands + Stochastic Oscillator (Volatility + Momentum)
- Setup:
- Bollinger Bands (20-period, 2 SD): Price hugging the upper band = strength, lower band = weakness. Tight bands = breakout brewing.
- Stochastic Oscillator (14,3,3): Overbought above 80, oversold below 20—catches reversals.
- Signal:
- Buy: Price breaks above tight Bollinger upper band and Stochastic crosses up from below 20 (e.g., USD/JPY coiling then spiking).
- Sell: Price cracks below lower band and Stochastic drops from above 80 (e.g., XRP tanking post-pump).
- Why It Works: Bands spot volatility shifts; Stochastic times the entry. Your screener loves this for explosive moves.
Combo 3: MACD + OBV (Trend + Volume)
- Setup:
- MACD (12,26,9): Bullish when MACD line crosses above signal line, bearish when below.
- On-Balance Volume (OBV): Rising OBV = buying pressure, falling = selling pressure.
- Signal:
- Buy: MACD crosses up and OBV trends higher (e.g., GBP/USD with steady volume behind the push).
- Sell: MACD crosses down and OBV slopes down (e.g., BTC dumping with volume confirmation).
- Why It Works: MACD tracks momentum, OBV validates with real money flow—cuts through fakeouts like a blade.
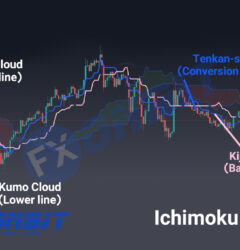
Combo 4: Ichimoku Cloud + ATR (Trend + Volatility)
- Setup:
- Ichimoku Cloud: Price above cloud = bullish, below = bearish. Cloud thickness shows support/resistance strength.
- Average True Range (ATR, 14-period): High ATR = wild moves, low ATR = calm waters.
- Signal:
- Buy: Price breaks above cloud and ATR spikes (e.g., ETH surging with volatility kicking in).
- Sell: Price falls below cloud and ATR jumps (e.g., EUR/USD crashing with big ranges).
- Why It Works: Cloud nails the trend, ATR flags when to pounce—ideal for your bots to ride crypto chaos or forex storms.
Pro Tips to Nail It
- Confirm, Don’t Chase: Wait for both indicators to align—jumping one signal is a rookie trap.
- Timeframe Match: Use 1-hour for scalping, daily for swings—mismatched frames mess up your bots.
- Backtest Like Crazy: Feed these combos into your AI robots—tweak settings (e.g., RSI 30 to 25) for max juice.
Why These Combos Rock Your Trading
Your AI robots can automate these signals—executing trades the second SMA+RSI says “go.” Your screeners can scan 100 pairs, flagging MACD+OBV setups in real time. Market it hard: “Our AI Bots Run SMA+RSI So You Don’t Have To—Profits on Autopilot.” Traders eat that up.
Read more: FXonbit CandleStick Pattern Finder Service: Your Gateway to Smarter Forex and Crypto Trading

Choosing Complementary Indicators
Using multiple technical indicators of the same type often leads to redundancy, rather than increased accuracy. Instead, traders should combine complementary technical indicators to confirm signals and avoid unnecessary complexity. Here are some effective combinations:
a) Moving Averages + RSI
Strategy: Use a moving average (e.g., 50-day or 200-day EMA) to identify the overall trend and RSI to confirm overbought or oversold conditions. Example: If the price is above the 50-day EMA and RSI is above 70, it may signal an overbought condition, suggesting a potential pullback.
b) MACD + Bollinger Bands
Strategy: Use MACD for trend confirmation and Bollinger Bands to identify volatility and potential breakouts. Example: A MACD bullish crossover occurring near the lower Bollinger Band may indicate a strong buying opportunity.
c) Stochastic Oscillator + Support & Resistance Levels
Strategy: Use the Stochastic Oscillator to identify momentum shifts near key support and resistance levels. Example: If the Stochastic Oscillator shows oversold conditions near a long-term support level, it may indicate a high-probability buying opportunity.
d) Volume Indicators + Price Action
Strategy: Use volume-based indicators to validate price movements and avoid false breakouts. Example: If a stock breaks out above resistance with high On-Balance Volume (OBV), it suggests strong buying interest and increases confidence in the breakout.
Explore more: What is Crypto Screener? The Best Crypto Screener
Building a Trading Strategy with Multiple Technical Indicators
Combining multiple technical indicators can help traders make more informed decisions and reduce false signals. The key is to ensure that each indicator serves a specific role and complements the others. Here’s a more detailed breakdown of the structured approach:
Step 1: Define Your Trading Goals
Before selecting technical indicators, determine your trading objectives:
- Scalping (Very Short-Term Trades): Requires fast indicators (e.g., Exponential Moving Averages, Stochastic Oscillator).
- Day Trading: Uses technical indicators that work well on intraday charts (e.g., VWAP, MACD, RSI).
- Swing Trading (Short to Medium-Term Trades): Relies on trend-following and momentum indicators (e.g., Moving Averages, RSI, Bollinger Bands).
- Long-Term Investing: Uses broader trend indicators (e.g., 200-day Moving Average, MACD on higher timeframes).
Understanding your style will guide the selection of the most suitable indicators.
Explore more: Risk Management in Trading: A Complete Guide for Traders
Step 2: Select a Primary Indicator (Trend Identification)
A primary indicator helps determine the overall market trend. Popular choices include:
- Moving Averages (MA, EMA, SMA): Helps smooth price data and identify trends.
- Example: If the 50-day MA is above the 200-day MA, the market is in an uptrend (Golden Cross).
- MACD (Moving Average Convergence Divergence): Measures trend strength and potential reversals.
- Example: A bullish crossover (MACD line above the signal line) suggests an uptrend.
- Ichimoku Cloud: A comprehensive trend indicator providing support/resistance and trend direction.
Step 3: Add a Confirming Indicator (Momentum Confirmation)
Once the trend is identified, a secondary indicator is needed to confirm trade signals. This helps filter out false signals.
- Relative Strength Index (RSI): Measures momentum and overbought/oversold conditions.
- Example: RSI above 70 suggests overbought conditions, while RSI below 30 suggests oversold conditions.
- Stochastic Oscillator: Similar to RSI but reacts faster to price movements.
- CCI (Commodity Channel Index): Identifies overbought/oversold conditions and trend strength.
💡 Tip: Choose an indicator from a different category to avoid redundancy. For example, pairing MACD (trend) with RSI (momentum) is better than using two trend indicators.
Read more: Price Action Trading: The Art of Trading Without Indicators
Step 4: Include a Volatility or Volume Indicator
To avoid false breakouts and gauge market strength, consider a volatility or volume indicator:
- Bollinger Bands: Expanding bands indicate higher volatility, while contracting bands signal consolidation.
- Example: A price breakout beyond the bands suggests strong momentum.
- On-Balance Volume (OBV): Confirms price movements with volume analysis.
- Example: If price increases with rising OBV, the trend is strong.
- Average True Range (ATR): Measures market volatility to set stop-loss levels.
Step 5: Test and Optimize the Strategy
Before trading with real money, validate your strategy:
- Backtest the strategy: Use historical data to check how the indicators performed in past market conditions.
- Optimize parameters: Adjust indicator settings (e.g., changing RSI from 14-period to 9-period for shorter-term trades).
- Demo trade: Test the strategy in a simulated environment before applying it to live markets.
Read more: Mastering the Martingale Trading Strategy
Example Strategy Using Multiple Technical Indicators
Scenario: Swing Trading on a Daily Chart
- Primary Trend Indicator: 50-day and 200-day Moving Averages (Golden Cross for uptrend).
- Confirming Indicator: RSI (Buy when RSI is near 30 and price aligns with trend).
- Volatility Indicator: Bollinger Bands (Enter when price breaks out of the bands).
- Volume Indicator: OBV (Ensures strong buying pressure before entry).
Combining multiple indicators can enhance accuracy, but avoid overloading your charts with too many technical indicators. Focus on:
✅ A trend indicator (e.g., Moving Average)
✅ A confirmation indicator (e.g., RSI)
✅ A volatility/volume indicator (e.g., Bollinger Bands, OBV)
Explore more: Symmetrical Triangle Pattern: A Powerful Price Action Signal
Avoiding Common Mistakes
Using multiple technical indicators can sharpen your trade signals, but it’s easy to trip over these traps if you’re not careful. Here’s the rundown on what can go wrong—Indicator Overload, Ignoring Market Context, and Over-Optimization—why they’ll burn your trades, and how to steer clear when you’re trading crypto or forex with tools like AI robots and screeners.
Read more: What is Scalp Crypto Trading
Indicator Overload: Too Many Signals, Too Much Noise
- What’s Happening: This is when you stack too many technical indicators—think RSI, MACD, Bollinger Bands, Stochastic, and a Moving Average all at once. You’re hoping for a bulletproof setup, but instead, you get a mess of mixed messages. RSI says “buy,” MACD says “sell,” and Bollinger’s just shrugging—good luck picking a direction.
- Why It Sucks: Too many voices drown out the signal. You either freeze up, missing the move, or jump on a dud trade because you can’t tell what’s real. For automated trading, like with AI robots, it’s even worse—too many inputs clog the system, spitting out late or shaky calls. Screeners end up flagging everything, burying the gold in junk.
- Example: Say BTC’s at $58,000. RSI dips below 30 (buy), but MACD’s still bearish (sell), and Bollinger Bands show a downtrend. You’re stuck guessing, and by the time you sort it out, BTC’s already bounced to $60k without you.
- How to Dodge It: Keep it tight—stick to 2-3 indicators that cover different angles, like SMA for trend and RSI for momentum. For robots, code them to need both to agree before pulling the trigger. For screeners, filter to just the combos that cut through the noise. Simple wins over cluttered every time.
Ignoring Market Context: Charts Don’t Tell the Whole Story
- What’s Happening: You’re glued to your technical indicators but blind to what’s moving the market—like a Fed rate hike, a crypto exchange hack, or some X post lighting a fire under ETH. Indicators crunch price and volume, but they don’t know a tweet just crashed sentiment or a jobs report flipped forex pairs.
- Why It Sucks: Signals that look perfect on the chart can turn to trash when the market’s got bigger fish to fry. You buy because Stochastic says “oversold,” but a regulatory ban just hit—your trade’s toast. Robots keep firing without a clue, and screeners pump out setups that don’t match the vibe on the street.
- Example: XRP’s at $0.80, OBV’s climbing, and MACD flips bullish—looks like a buy. But X shows a whale dumping rumors, and it craters to $0.65 an hour later. If you’d checked the chatter, you’d have sat it out.
- How to Dodge It: Don’t trade in a vacuum. Peek at the economic calendar for forex—like Non-Farm Payrolls—or skim X for crypto buzzwords like “pump” or “FUD.” Tell your robots to chill during big news drops. Set your screeners to cross-check signals with sentiment spikes. Charts are half the game—context’s the other half.
Explore more: What is Forex Screener? Free Trading Opportunities with a Comprehensive Tool
Over-Optimization: Backtest Dreams, Live Nightmares
- What’s Happening: You tweak your technical indicators—like nudging RSI from 30 to 25 or MACD from 12,26,9 to 10,20,5—until your backtest looks like a money printer. It’s called curve-fitting: you’ve molded it to fit past trades so tight it’s useless for what’s coming.
- Why It Sucks: Markets don’t rerun the same playbook. That perfect setup from last year’s BTC bull run flops when volatility shifts or forex pairs go sideways. Your robots, tuned to old glory, miss live action or bleed cash. Screeners skip real setups because they’re stuck on yesterday’s magic numbers.
- Example: You dial in Bollinger Bands (15, 1.5 SD) and Stochastic (10,2,2) to slay EUR/USD in 2022’s backtest—90% wins. Fast forward to now, a Fed shakeup spikes volatility, and your overcooked settings miss the boat—trades fizzle at 50/50.
- How to Dodge It: Stick to default settings—like RSI 14 or MACD 12,26,9—unless you’ve got live proof to tweak. Backtest across bull runs, crashes, and dead zones, not just one hot streak. For robots, add some flex (e.g., “Adjust ATR if ranges double”). For screeners, keep thresholds broad enough to catch today’s moves. Solid beats fragile.
Read Related: What Is Forex Risk Management?
Conclusion
Combining technical indicators effectively can significantly improve trade accuracy and reduce risk. By selecting complementary technical indicators, defining a structured strategy, and backtesting thoroughly, traders can optimize their decision-making process. The key is to balance simplicity with effectiveness, ensuring that each indicator adds value to the overall strategy. With practice and discipline, traders can enhance their ability to identify high-probability trading opportunities and maximize their success in the markets.
Hi, I’m Asena, a Senior Marketing Specialist with over 8 years of experience and a deep passion for trading knowledge. I have a genuine fascination with the world of Crypto and Forex markets. Over the past 6 years, I’ve dedicated myself to writing about technical analysis, fundamental analysis, and the intricate dynamics of these markets. My mission is to provide the most complete and comprehensive data to empower my audience with actionable insights. I truly love what I do and constantly strive to deliver the best possible results for my readers and users.

Asena Taremi