08 Mar

The symmetrical triangle pattern is a key price action formation in technical analysis, known for signaling potential trend continuation or reversal. It appears as a converging triangle on the chart, where price movements narrow over time, creating a structure of lower highs and higher lows.
Traders often rely on this pattern to anticipate future price movements, as a breakout from the triangle dictates the next market direction.
Start Our Crypto & Forex Dashboard For Free
Understanding the Symmetrical Triangle Pattern
A symmetrical triangle forms when price action consolidates within two trendlines—one sloping downward and the other upward—eventually leading to a breakout. Unlike other patterns, it does not have a strong directional bias before the breakout occurs, making it a useful tool for both bullish and bearish scenarios.
Read More: Trading Chart Patterns: What Are Chart Patterns? + PDF
Key characteristics of a symmetrical triangle:
- The pattern consists of at least four price swings, with each successive wave being shorter than the previous one.
- It is usually found at significant price levels, such as support and resistance zones or supply and demand areas.
- The breakout direction determines the subsequent trend movement—an upward breakout signals bullish momentum, while a downward breakout indicates bearish continuation.

Explore more: Crypto Whale Tracker Guide: How to Follow the Biggest Players in the Market
How to Identify a Symmetrical Triangle on a Chart
To recognize a valid symmetrical triangle pattern, traders should look for the following:
- Series of Lower Highs and Higher Lows: The price compresses as the market enters a phase of indecision, forming a triangle shape.
- Converging Trendlines: The highs and lows of price movements should connect with trendlines that move toward each other.
- Formation at Key Levels: A strong symmetrical triangle is more reliable when it appears near critical support, resistance, or demand zones.
- At Least Four Waves: To confirm the pattern, a minimum of four price swings should be visible, ensuring a proper structure before a breakout occurs.

Read more: Trading the Head and Shoulders Pattern: A Complete Guide
The Psychology Behind the Symmetrical Triangle Pattern
This pattern represents market indecision, where neither buyers nor sellers have full control. As the price range contracts, institutional traders and market makers wait for the ideal moment to drive prices in their preferred direction.
- If the price breaks above the upper trendline, it indicates buyers have gained control, leading to a bullish breakout.
- Conversely, if the price breaks below the lower trendline, sellers dominate, causing a bearish breakout.
- A symmetrical triangle reflects a battle between supply and demand, with the breakout revealing the winning side.
Read more: Bullish Rectangle Pattern: A Trader’s Complete Guide

How to Identify a Valid Breakout
False breakouts are common with symmetrical triangles, so traders should confirm validity before entering a trade. Here are two effective methods to avoid getting trapped:
- Trade with the Trend: The most reliable breakouts occur in the direction of the prevailing trend. If the market is in an uptrend, prioritize bullish breakouts, and in a downtrend, focus on bearish breakouts.
- Look for Strong Candlestick Momentum: A valid breakout is usually accompanied by a large-bodied candlestick with minimal wicks. Ideally, the breakout candle should be larger than the previous 20–50 candlesticks, signifying strong momentum and commitment from institutional traders.
Chart Pattern: Bump and Run Pattern: A Comprehensive Guide

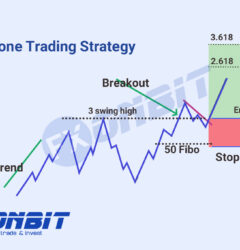
Symmetrical Triangle Trading Strategy
Although the symmetrical triangle pattern is not always a high-reward setup, it becomes powerful when combined with other technical strategies. Here’s a step-by-step trading plan:
1. Entry Point: Open a trade immediately after a confirmed breakout. A bullish breakout calls for a buy order, while a bearish breakout signals a sell order.
2. Stop-Loss Placement:
- For a bearish breakout, place the stop-loss slightly above the second-last lower high.
- For a bullish breakout, place the stop-loss just below the second-last higher low.
Explore more: How to Combine Technical Indicators for More Accurate Trade Signals

3. Take-Profit Target: To determine the take-profit level, follow these steps:
- Measure the Height of the Base: The base of the symmetrical triangle is the widest part of the pattern, formed by the initial price swing.
- Project the Height from the Breakout Point: Take the measured height and extend it upwards if the breakout is bullish, or downwards if the breakout is bearish.
- Set the Target at This Projected Level: This projected level serves as the take-profit point, offering a logical exit strategy based on price movement expectations.
Explore more: Risk Management in Trading: A Complete Guide for Traders
For example, if the base of the symmetrical triangle is 100 pips high, and a breakout occurs at 1.2000, the take-profit level would be set at 1.2100 for a bullish breakout or 1.1900 for a bearish breakout.

Explore more: What is MACD? Full Guidance
Optimal Conditions for Trading the Symmetrical Triangle Pattern
Before entering a trade based on the symmetrical triangle pattern, identifying the ideal market conditions can significantly improve the probability of success.
Here are the key factors that enhance the effectiveness of this pattern:
1. Formation at Key Price Levels
- The symmetrical triangle pattern is more reliable when it develops at important support or resistance levels.
- A bullish breakout is more effective if the pattern forms near a support or demand zone.
- A bearish breakout has a higher probability of success if the pattern emerges near a resistance or supply zone.
Explore more: Advanced Technical Analysis: Using Divergences and Convergences for Precision Trading
2. Position in the Price Chart
- The pattern tends to perform better when it forms at extremes of the price chart rather than in the middle of a trend.
- If the symmetrical triangle appears in an overbought area, it may indicate an upcoming bearish move.
- If it forms in an oversold area, it increases the likelihood of a bullish breakout.
Read more: Price Action Trading: The Art of Trading Without Indicators
3. Avoid Sideways Markets
- The symmetrical triangle is a continuation pattern, meaning it works best in a trending market.
- If the market is moving sideways (range-bound), the pattern becomes less effective and may lead to false breakouts.
- Ideally, it should appear within an established trend, confirming a potential continuation of the existing price movement.
By applying these conditions as filters before trading, traders can improve their chances of capturing high-probability setups and reducing false signals.

Conclusion
The symmetrical triangle pattern is a valuable tool for traders seeking to forecast market direction. While it can signal both trend continuation and reversals, the breakout confirmation is crucial before executing trades. Understanding market psychology, recognizing valid breakouts, and applying a structured trading plan will enhance success when using this pattern.
Pro Tip: Always backtest your strategy and combine it with other confluences before live trading.
Explore more: Analyzing Volume Patterns for Breakout & Reversal Signals

FAQs
What is the best timeframe to trade the symmetrical triangle pattern? It can be traded across all timeframes, but higher timeframes (15M and above) provide more reliable breakouts with fewer false signals.
Is the symmetrical triangle a continuation or reversal pattern? It can act as both. The breakout direction determines whether it continues the previous trend or reverses it.
How do I avoid false breakouts when trading symmetrical triangles? Trade in the direction of the prevailing trend and look for a strong candlestick with high momentum before entering a trade.
What indicators can be used to confirm a symmetrical triangle breakout? Volume analysis, moving averages, and RSI (Relative Strength Index) can help confirm breakout strength and prevent false signals.
Can symmetrical triangle patterns be used for short-term trading? Yes, but they are more reliable in higher timeframes. In lower timeframes, traders should be extra cautious about false breakouts.
Should I trade symmetrical triangles alone or combine them with other strategies? It’s best to use symmetrical triangles in combination with other technical indicators and strategies for better trade accuracy and risk management.
Hi, I’m Asena, a Senior Marketing Specialist with over 8 years of experience and a deep passion for trading knowledge. I have a genuine fascination with the world of Crypto and Forex markets. Over the past 6 years, I’ve dedicated myself to writing about technical analysis, fundamental analysis, and the intricate dynamics of these markets. My mission is to provide the most complete and comprehensive data to empower my audience with actionable insights. I truly love what I do and constantly strive to deliver the best possible results for my readers and users.


Asena Taremi