23 Jul

Enter the candlestick chart – a visual storyteller in the world of trading. In this journey, we unravel the significance of candlestick patterns, exploring their forms and how they shape decisions in Forex and crypto trading.
Candlestick patterns unveil market sentiment, hinting at reversals, continuations, and indecision. Join us as we dissect common patterns, providing a roadmap for traders to navigate the ever-changing landscape of financial markets with precision and confidence.
Read more: FXonbit CandleStick Pattern Finder Service: Your Gateway to Smarter Forex and Crypto Trading
A candlestick is a visual representation of price movements within a specific time frame. One such powerful tool is the candlestick chart, which provides valuable insights into price movements and market sentiment.
Explore more: Overcoming FOMO: The Fear of Missing Out
What is a Candlestick Pattern?
A candlestick serves as a visual representation of an asset’s price movements, widely employed in technical analysis for quick interpretation of market dynamics. Each candlestick typically consists of four key components: the open, close, high, and low prices.
Explore more: Advanced Technical Analysis: Using Divergences and Convergences for Precision Trading
The body of the candlestick represents the price range between the open and close, while the wicks or shadows extend above and below, indicating the high and low prices reached during the period. This analysis focuses on daily charts, where each candlestick encapsulates a day’s trading activity, featuring three primary components:
The Body:
Representing the open-to-close range, the body of the candlestick provides insight into price movement within a specific timeframe.
The Wick (Shadow):
Extending beyond the body, the wick indicates the intra-day high and low points, offering valuable information about price fluctuations.
The Color:
A crucial element, the color of the body conveys market direction. A green or white body signifies a price increase, while a red or black body denotes a price decrease.
Chart Pattern: How to Trade the Ascending Channel?

As time progresses, these candlesticks create patterns, serving as key tools for traders to identify significant support and resistance levels. Numerous candlestick patterns emerge, offering insights into buying and selling pressures, recognizing continuation patterns, and highlighting instances of market indecision.
Explore more: What is Crypto Screener? The Best Crypto Screener
Reading candlestick patterns
Mastering the art of reading candlestick patterns requires both knowledge and practical experience. At FXonbit, we offer a unique simulated trading environment where traders can refine their skills without financial risk. By utilizing our demo trading platform, you can practice identifying patterns and testing strategies in real-time market conditions.
Read more: Mastering Ichimoku Cloud Trade; Specialized Topics
While candlestick patterns are highly effective for predicting trends, combining them with other technical analysis tools is essential for a holistic understanding of market behavior. FXonbit’s platform integrates advanced indicators, charting tools, and AI-driven insights to help traders make informed decisions.
Start with a demo account on FXonbit to refine your skills and transition seamlessly into live trading when ready. Leverage our powerful tools and resources to enhance your trading proficiency and unlock your full potential in the markets.
Read more: What is Forex Screener? Free Trading Opportunities with a Comprehensive Tool
40 Powerful Candlestick Patterns:
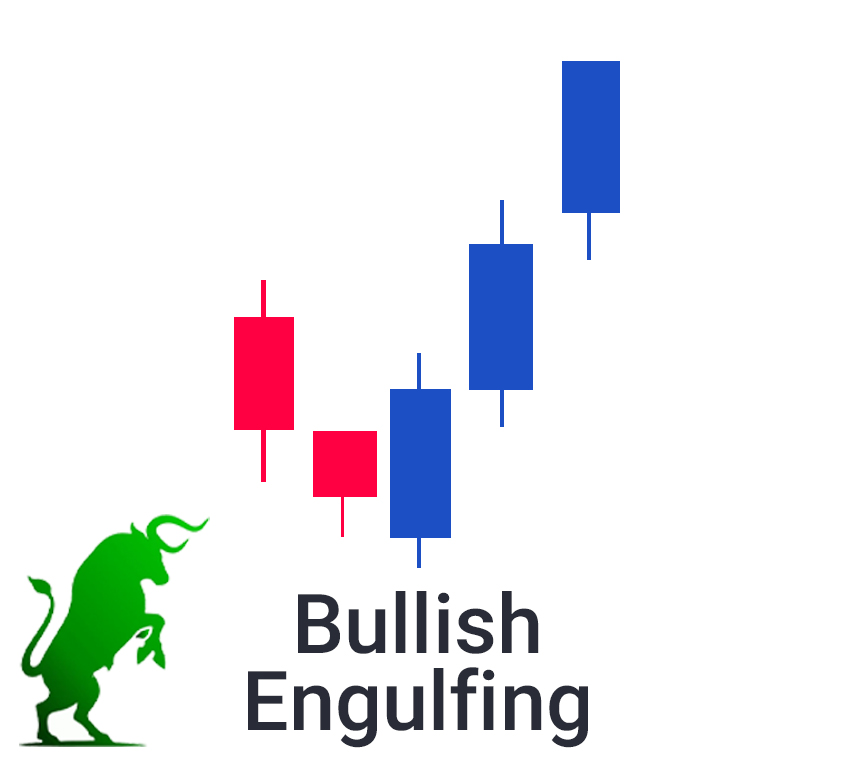
1. Bullish Engulfing
The Bullish Engulfing pattern signifies a strong shift from selling to buying momentum, often appearing at the bottom of a price trend. It forms when a small bearish candle is entirely engulfed by a larger bullish candle. This signals that buyers have taken control and the market may move upward.
-
Key Traits:
-
A small bearish candle followed by a larger bullish candle.
-
Appears at the end of a downtrend.
-
-
Trading Tip: Enter long once the bullish candle closes. Set stop-loss below the engulfing candle’s low.
Explore more: Top Indicators in Crypto Screeners for Effective Trading
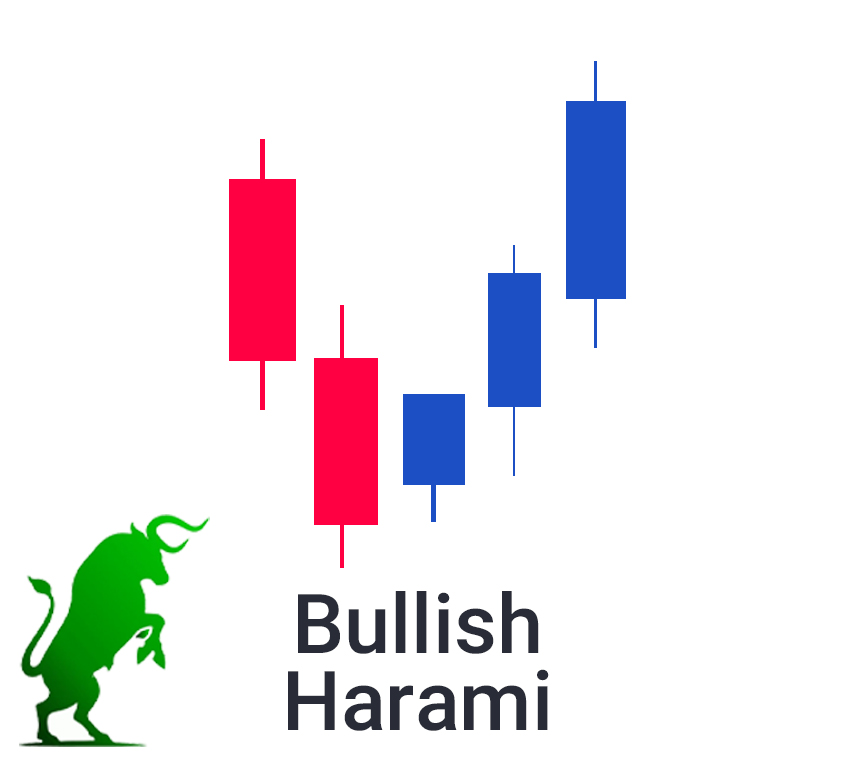
2. Bullish Harami
The Bullish Harami indicates a weakening bearish trend and potential reversal. A small bullish candle forms within the body of a preceding larger bearish candle.
-
Key Traits:
-
Two candles: a large bearish followed by a smaller bullish candle.
-
Often found at the bottom of a trend.
-
-
Trading Tip: Wait for confirmation with the next candle closing bullish.
Read more: Exponential Moving Average (EMA): A Comprehensive Guide for Traders
3. Tweezer Bottom
The Tweezer Bottom suggests strong support at a specific price level, forming two or more candles with identical lows.

-
Key Traits:
-
Consecutive candles with matching lows.
-
Typically signals a reversal during a downtrend.
-
-
Trading Tip: Look for additional bullish confirmation before entering a trade.
Read More: Trading Chart Patterns: What Are Chart Patterns? + PDF
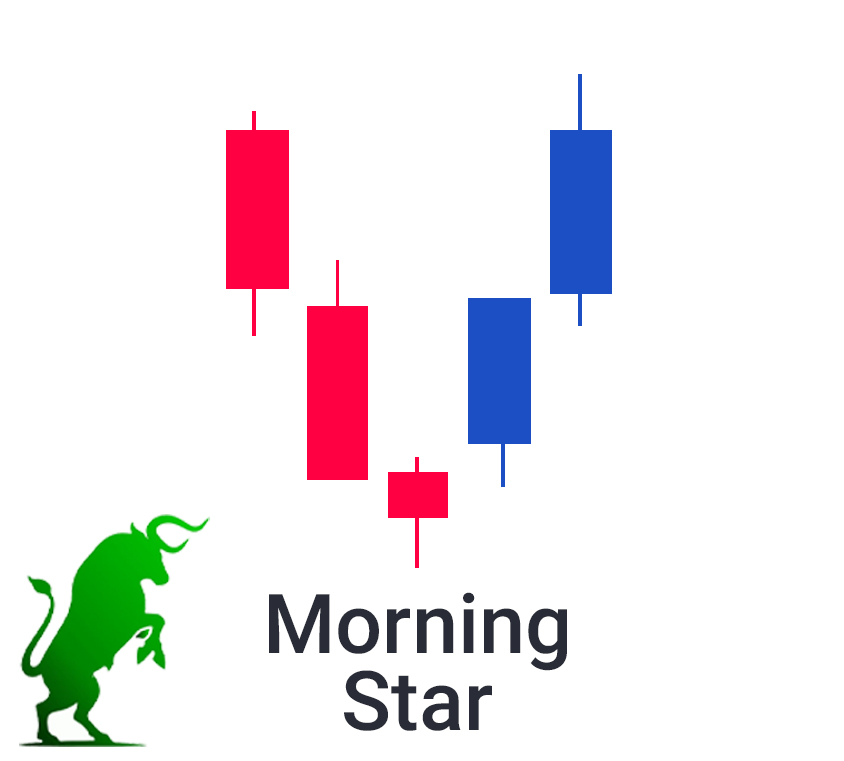
4. Morning Star
A Morning Star is a reliable bullish reversal pattern consisting of three candles: a bearish, a small-bodied (doji or indecisive), and a bullish candle.
-
Key Traits:
-
Appears after a downtrend.
-
Signals a transition from selling to buying momentum.
-
-
Trading Tip: Enter long after the third candle closes bullish. Place stop-loss below the doji.
5. Morning Star Doji
This variation of the Morning Star features a doji as the middle candle, emphasizing indecision and a potential reversal.

-
Key Traits:
-
Three candles: bearish, doji, and bullish.
-
-
Trading Tip: Confirm the trend change with the third candle’s close above the previous high.
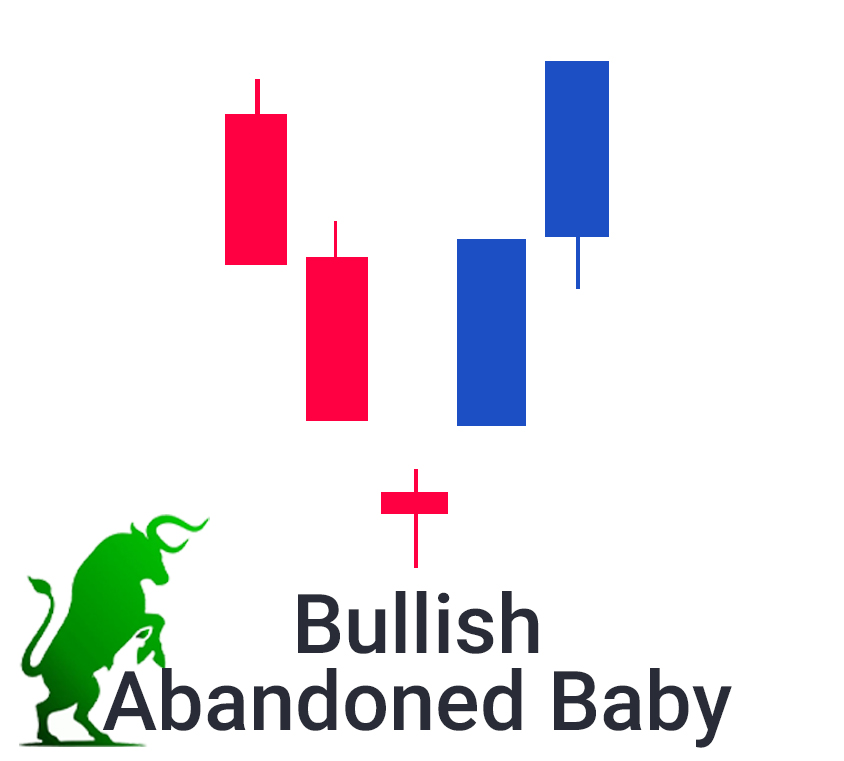
6. Bullish Abandoned Baby
The Bullish Abandoned Baby forms with a bearish candle, a doji gapping down, and a bullish candle gapping up, signaling a reversal.
-
Key Traits:
-
Gaps on both sides of the doji.
-
Appears after a downtrend.
-
-
Trading Tip: Enter long after the bullish candle confirms upward momentum.
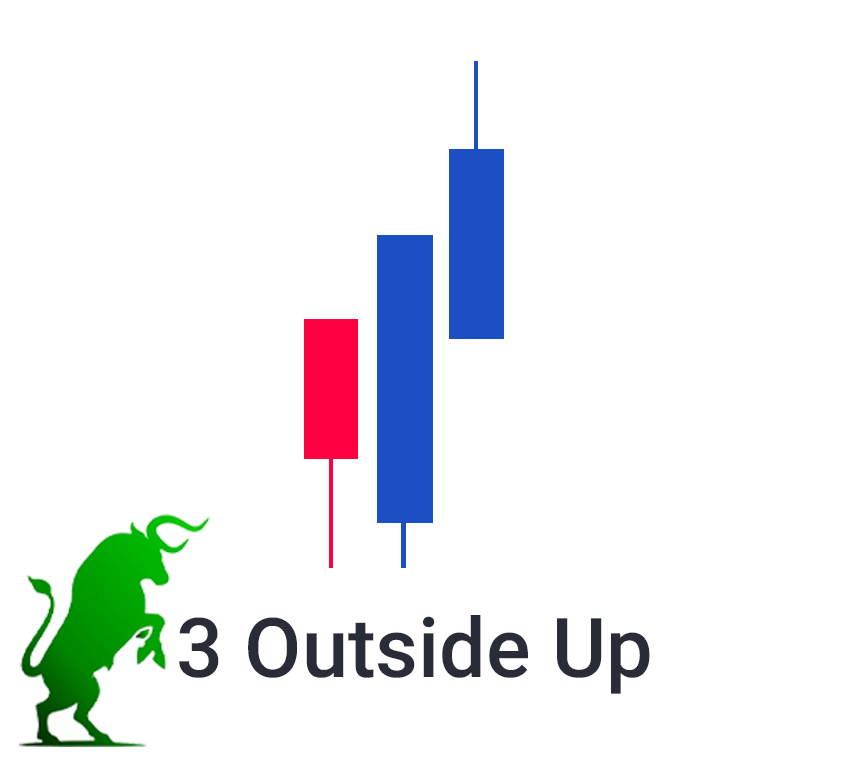
7. Three Outside Up
The Three Outside Up pattern starts with a bearish candle, followed by a bullish candle engulfing it, and another bullish candle confirming the uptrend.
-
Key Traits:
-
Three candles: bearish, engulfing bullish, and confirmation bullish.
-
-
Trading Tip: Place stop-loss below the first candle’s low.
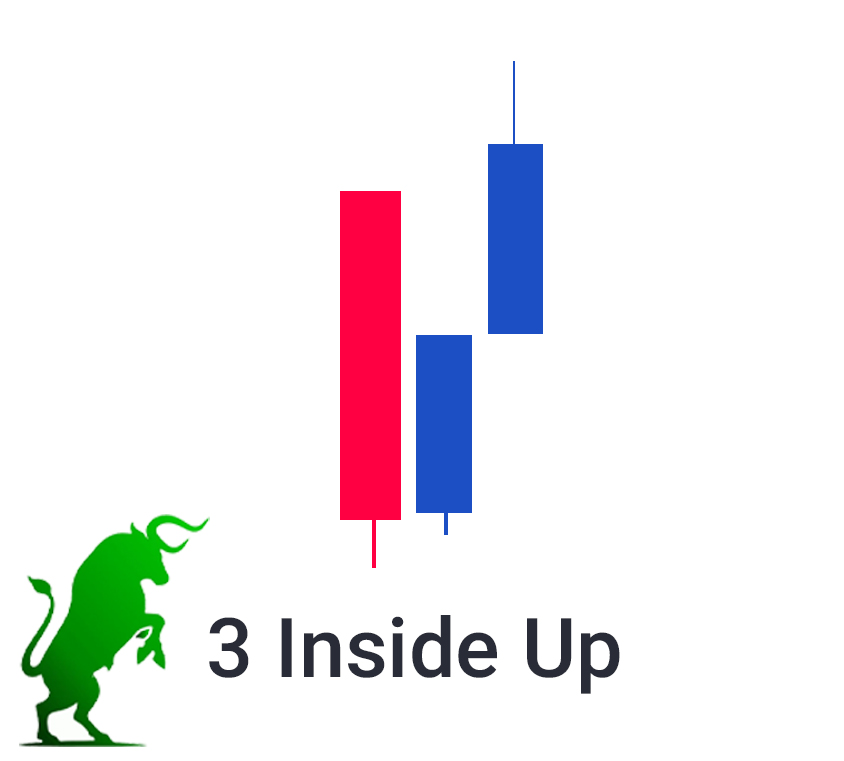
8. Three Inside Up
This pattern indicates a reversal, starting with a bearish candle, a small bullish candle inside it, and a strong bullish confirmation candle.
-
Key Traits:
-
Three candles: bearish, small bullish, and strong bullish.
-
-
Trading Tip: Confirm reversal with the third candle closing higher.
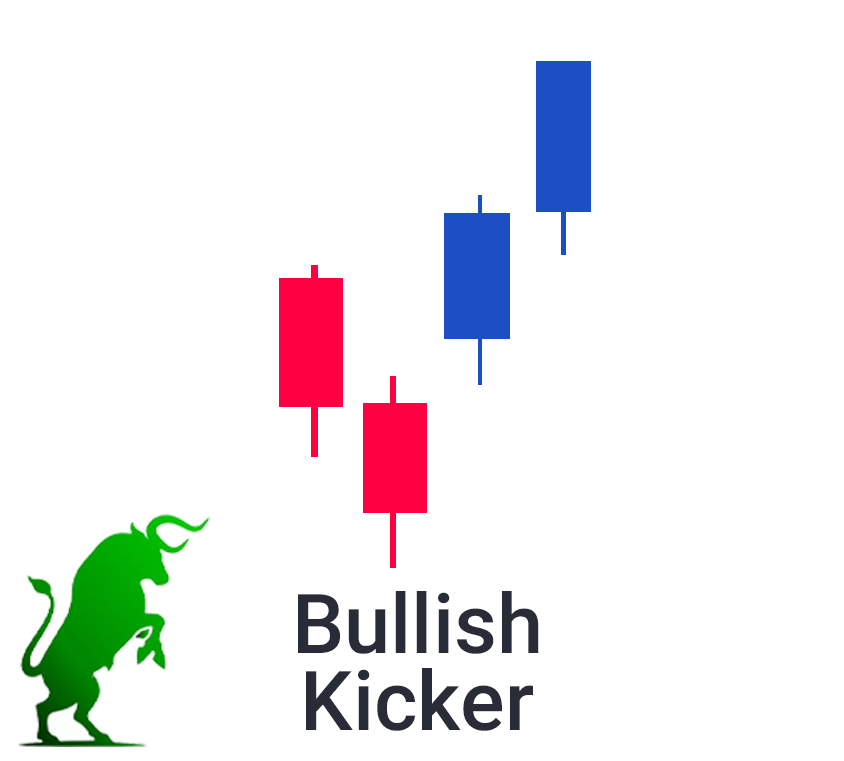
9. Bullish Kicker
A Bullish Kicker forms when a bearish candle is immediately followed by a bullish candle that gaps up significantly, showing a sudden shift in sentiment.
-
Key Traits:
-
No overlap between bearish and bullish candles.
-
-
Trading Tip: Enter long after the bullish candle closes.
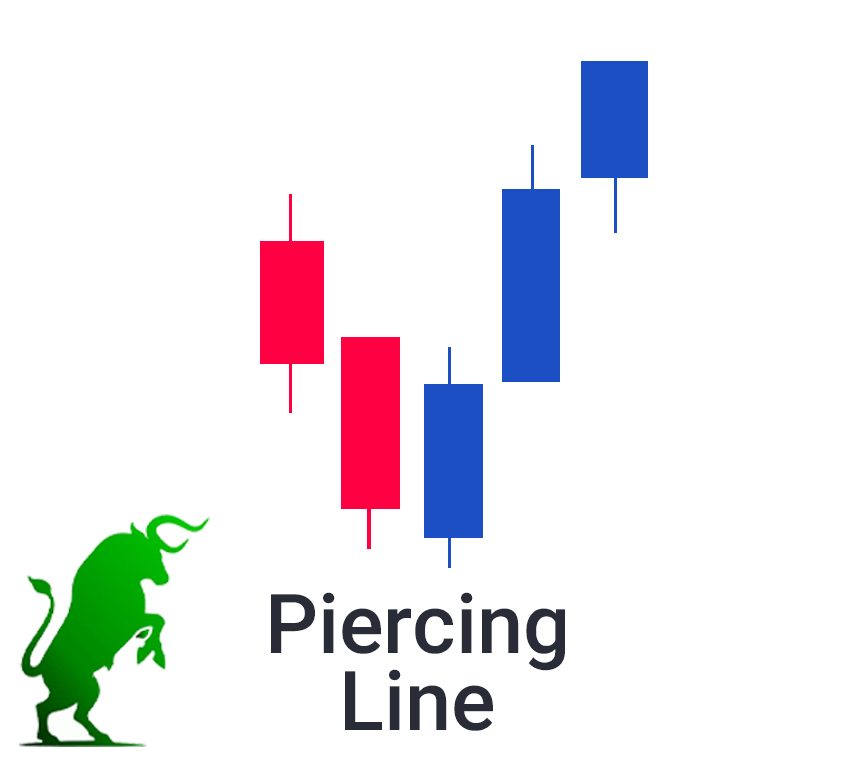
10. Piercing Line
The Piercing Line forms when a bearish candle is followed by a bullish candle that opens lower but closes above the midpoint of the previous candle.
-
Key Traits:
-
Appears at the end of a downtrend.
-
-
Trading Tip: Confirm upward momentum with a close above the midpoint.
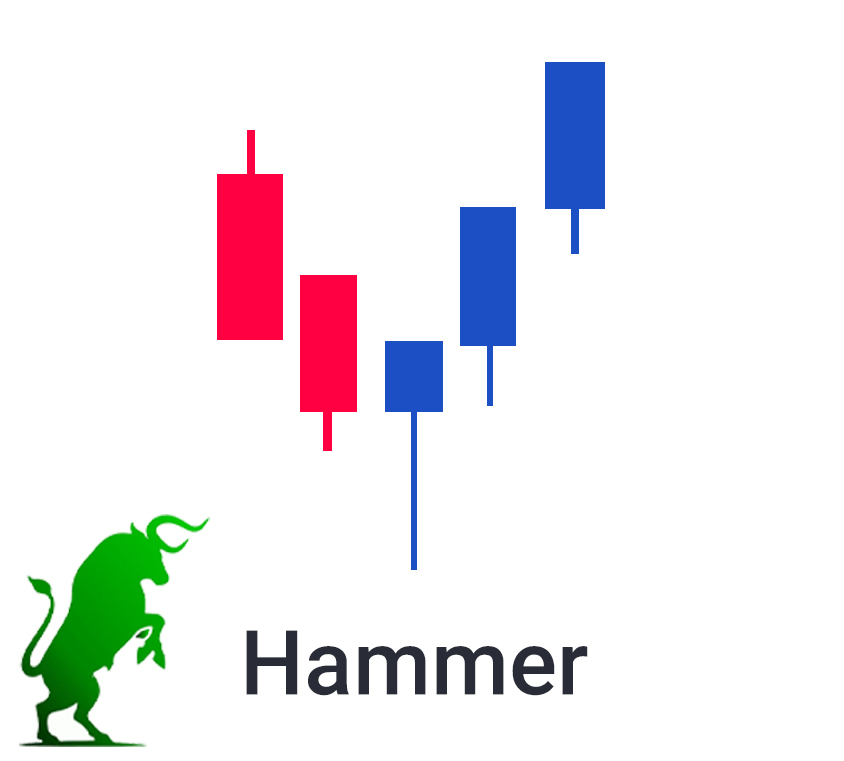
11. Hammer
The Hammer is a single candlestick pattern appearing at the bottom of a downtrend, characterized by a small body and long lower wick.
-
Key Traits:
-
Small body near the high of the session.
-
Long lower wick indicates strong buying pressure.
-
-
Trading Tip: Place stop-loss below the candle’s low and target nearby resistance.
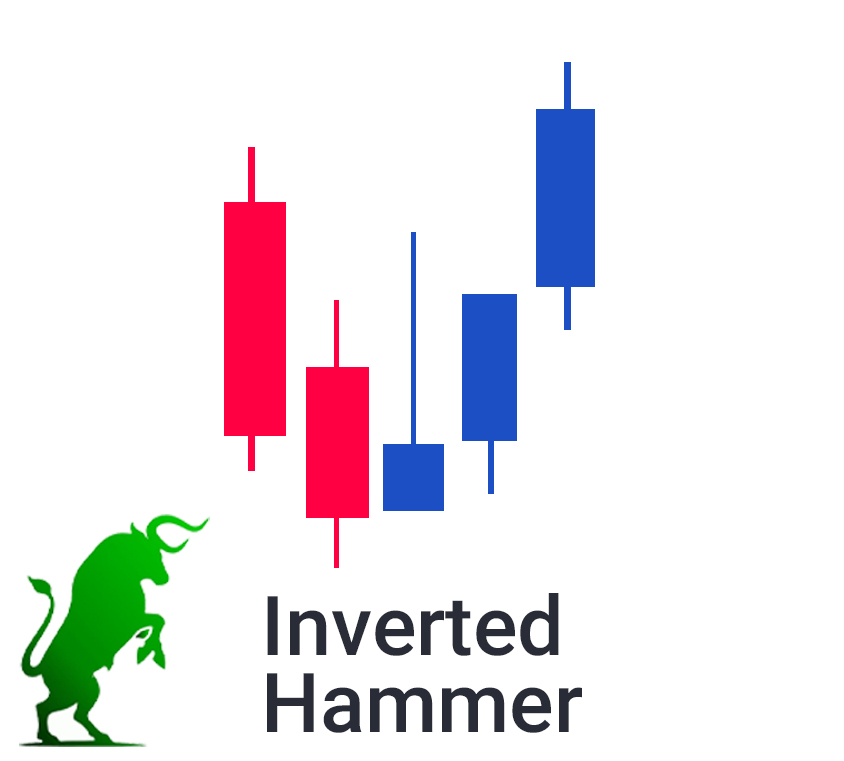
12. Inverted Hammer
The Inverted Hammer signals a potential reversal after a downtrend. It has a small body and a long upper wick.
-
Key Traits:
-
Appears at the bottom of a downtrend.
-
-
Trading Tip: Wait for confirmation from the next bullish candle.
Read more: Price Action Trading: The Art of Trading Without Indicators
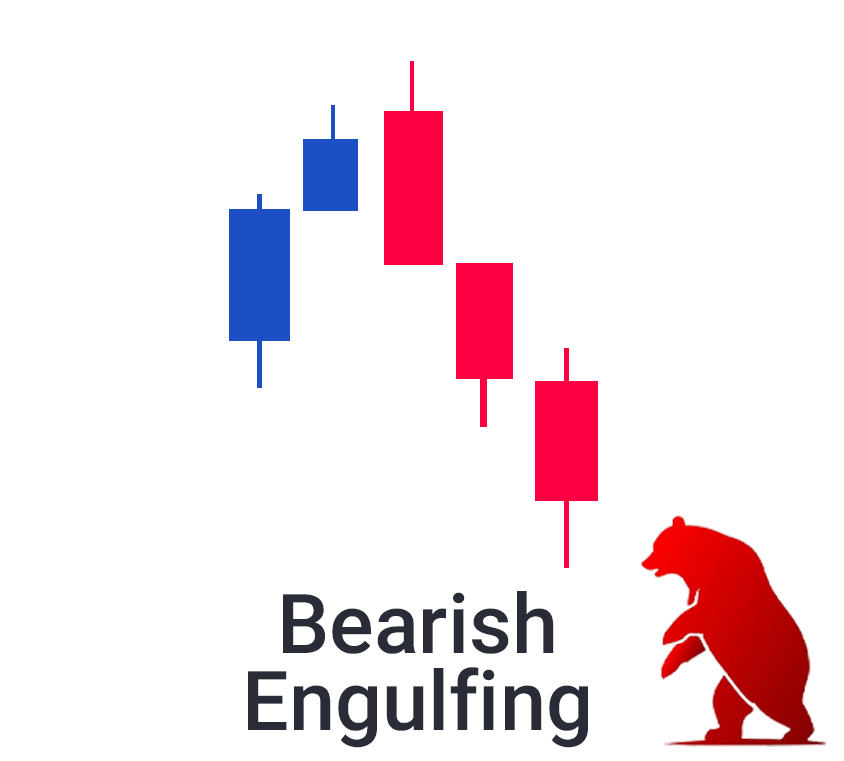
13. Bearish Engulfing
The Bearish Engulfing pattern forms at the top of an uptrend when a small bullish candle is followed by a larger bearish candle engulfing it.
-
Key Traits:
-
Signals a bearish reversal.
-
-
Trading Tip: Enter short below the bearish candle’s low.
Read more: Mastering Range Trading: A Complete Guide for Crypto Traders
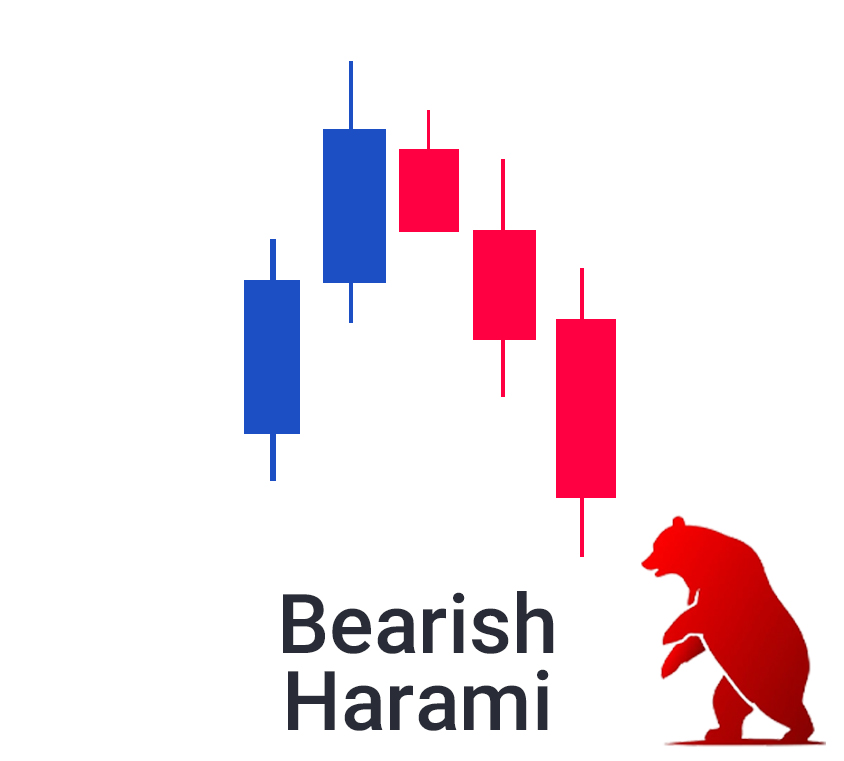
14. Bearish Harami
The Bearish Harami signals a weakening bullish trend. A small bearish candle forms within the body of a larger bullish candle.
-
Key Traits:
-
Found at the top of an uptrend.
-
-
Trading Tip: Confirm reversal with the next bearish candle.
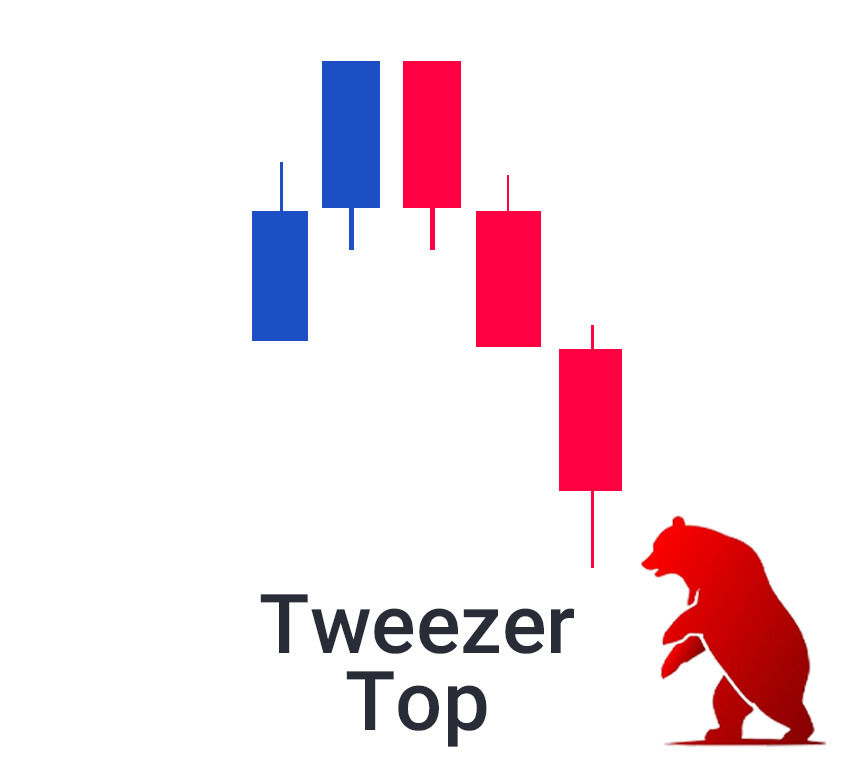
15. Tweezer Top
The Tweezer Top indicates strong resistance at a specific price level, forming two or more candles with identical highs.
-
Key Traits:
-
Consecutive candles with matching highs.
-
-
Trading Tip: Look for additional bearish confirmation.
Read this Chart Pattern: Bullish Rectangle Pattern: A Trader’s Complete Guide
16. Evening Star
The Evening Star is a three-candle bearish reversal pattern appearing after an uptrend.

-
Key Traits:
-
Bullish, indecisive (doji), and bearish candles.
-
-
Trading Tip: Confirm reversal with the third candle’s close below the midpoint of the first.
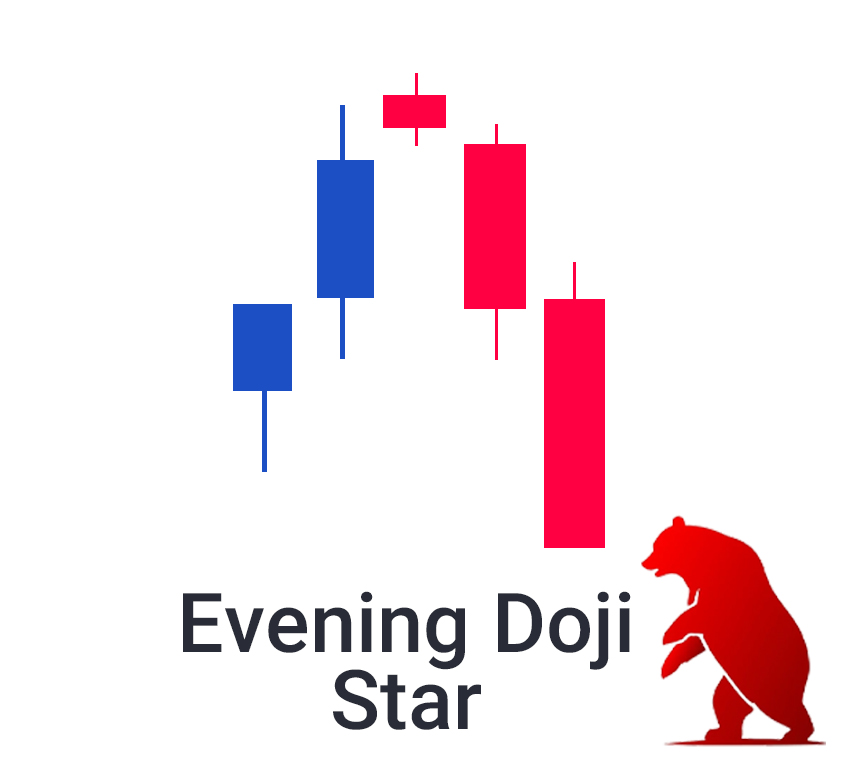
17. Evening Star Doji
This variation includes a doji as the middle candle, emphasizing indecision before a bearish reversal.
-
Key Traits:
-
Doji in the middle of the pattern.
-
-
Trading Tip: Ensure confirmation with the third bearish candle.
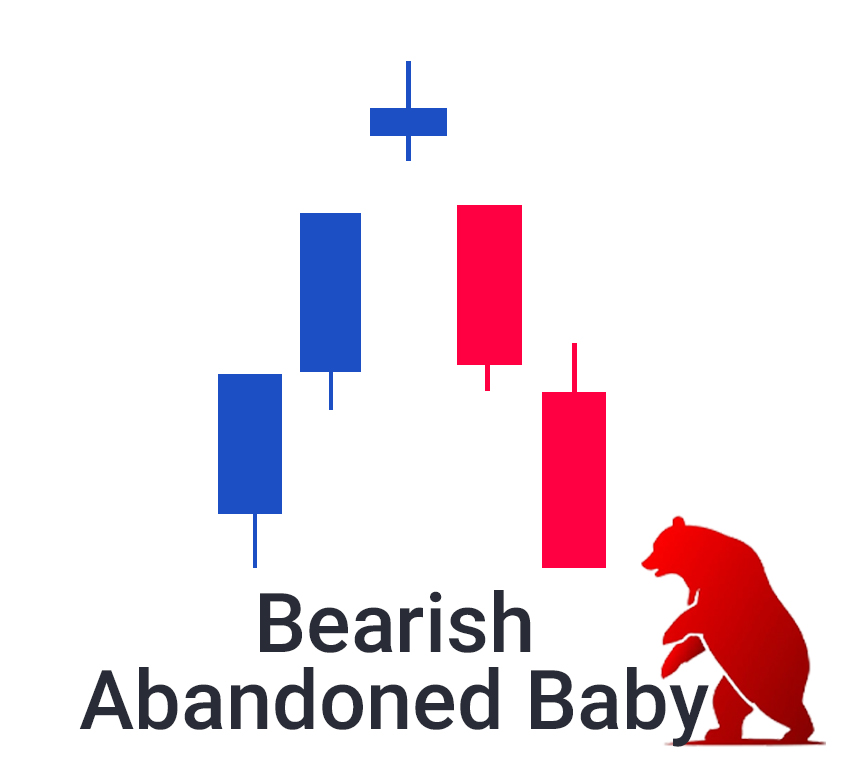
18. Bearish Abandoned Baby
The Bearish Abandoned Baby forms with a bullish candle, a doji gapping up, and a bearish candle gapping down.
-
Key Traits:
-
Gaps on both sides of the doji.
-
-
Trading Tip: Enter short after confirmation.
Chart Pattern: Bump and Run Pattern: A Comprehensive Guide
19. Three Outside Down
The Three Outside Down consists of a bullish candle, a bearish candle engulfing it, and a confirmation bearish candle.

-
Key Traits:
-
Indicates a bearish reversal.
-
-
Trading Tip: Enter short below the third candle.
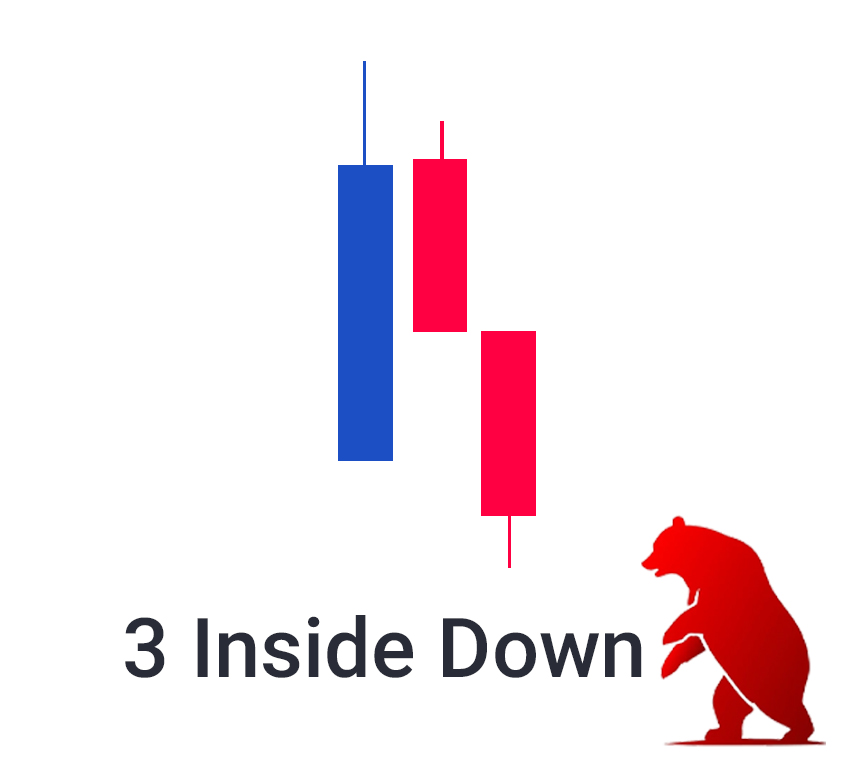
20. Three Inside Down
This pattern suggests a reversal, beginning with a bullish candle, followed by a small bearish candle, and a strong bearish confirmation candle.
-
Key Traits:
-
Indicates sellers are gaining control.
-
-
Trading Tip: Enter short after the third candle.
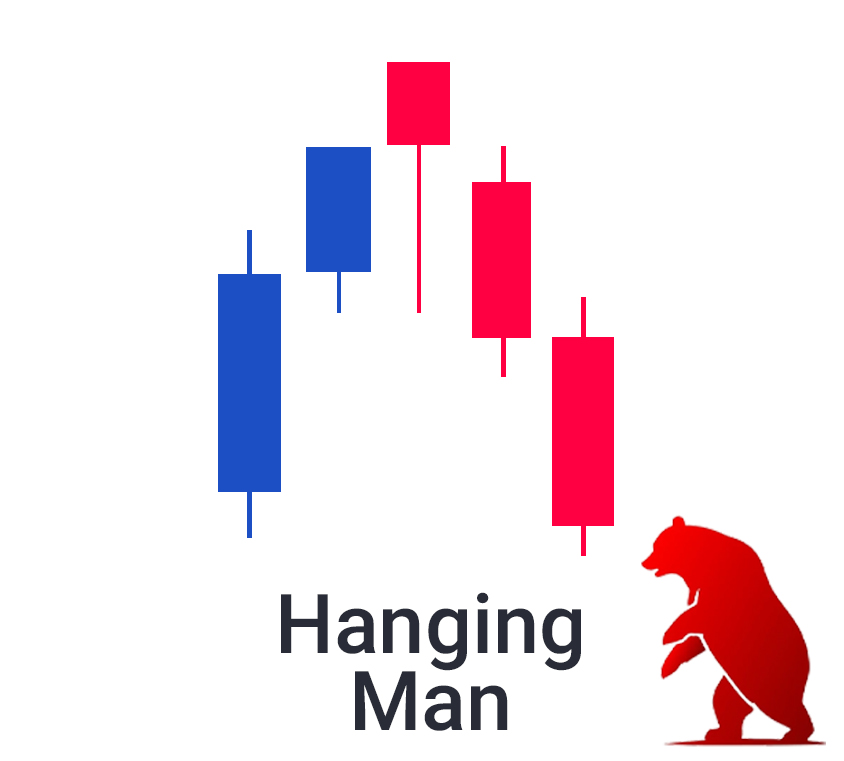
21. Hanging Man
The Hanging Man is a bearish reversal pattern that forms at the top of an uptrend. It features a small body and a long lower wick.
-
Key Traits:
-
Appears after a bullish trend.
-
-
Trading Tip: Confirm reversal with a bearish candle closing below the hanging man’s low.
Read more: Trading the Inverse Head and Shoulders Pattern: A Comprehensive Guide for Traders
22. Bearish Kicker
The Bearish Kicker is a strong reversal pattern where a bullish candle is followed by a bearish candle that gaps down significantly.

-
Key Traits:
-
No overlap between the bullish and bearish candles.
-
-
Trading Tip: Enter short after the bearish candle confirms the reversal.
Chart: Descending Broadening Wedge Definition & Trading Strategy
23. Dark Cloud Cover
The Dark Cloud Cover pattern forms when a bullish candle is followed by a bearish candle that opens above the previous high but closes below the midpoint of the bullish candle.

-
Key Traits:
-
Signals a potential bearish reversal.
-
-
Trading Tip: Wait for confirmation with the next bearish candle.
24. Shooting Star
The Shooting Star is a single bearish reversal candle with a small body and a long upper wick, forming at the top of an uptrend.

-
Key Traits:
-
Indicates rejection of higher prices.
-
-
Trading Tip: Confirm with a bearish close below the shooting star’s low.
25. Three Black Crows
The Three Black Crows pattern consists of three consecutive bearish candles with lower highs and lower lows, signaling strong selling pressure.

-
Key Traits:
-
Appears after an uptrend.
-
-
Trading Tip: Use it as confirmation of a trend reversal before entering short.
26. Rising Three
The Rising Three is a bullish continuation pattern featuring a long bullish candle, three small bearish candles within its range, and another bullish candle closing higher.
-
Key Traits:
-
Indicates continuation of an uptrend.
-
-
Trading Tip: Enter long after the final bullish candle confirms.
Explore more: Best Forex Screeners for Day Trading
27. Falling Three
The Falling Three is a bearish continuation pattern with a long bearish candle, three small bullish candles within its range, and another bearish candle closing lower.
-
Key Traits:
-
Indicates continuation of a downtrend.
-
-
Trading Tip: Enter short after the final bearish candle confirms.
28. Tasuki Gap
The Tasuki Gap forms during a trend and consists of a gap between the first and second candles, with the third candle partially filling the gap.
-
Key Traits:
-
Appears in both bullish and bearish trends.
-
-
Trading Tip: Confirm the trend continuation before entering.
29. Mat Hold
The Mat Hold pattern features a strong trend candle, three smaller counter-trend candles, and another strong trend candle resuming the movement.
-
Key Traits:
-
Indicates a brief pause before the trend resumes.
-
-
Trading Tip: Enter after the final candle confirms the trend.
30. Inside Bars
The Inside Bars pattern occurs when a smaller candle is entirely contained within the high and low of the previous larger candle.
-
Key Traits:
-
Signals consolidation or indecision.
-
-
Trading Tip: Wait for a breakout in either direction before entering.
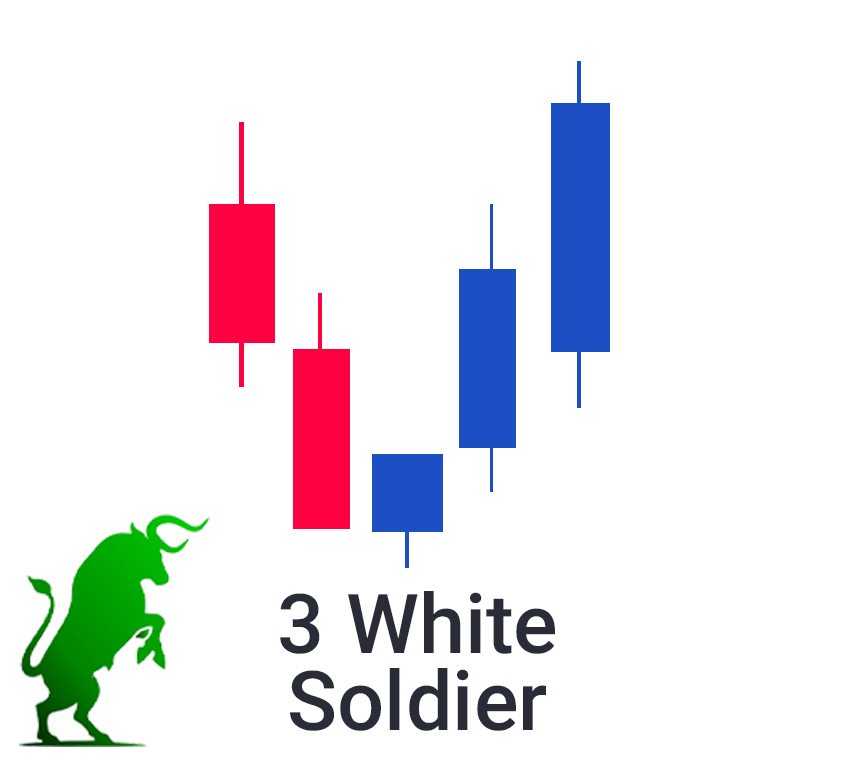
31. Three White Soldiers
The Three White Soldiers consists of three consecutive bullish candles with higher closes, signaling strong buying momentum.
-
Key Traits:
-
Appears after a downtrend.
-
-
Trading Tip: Enter long as momentum builds.
32. Marubozu
The Marubozu has no wicks, indicating strong momentum in the direction of the candle.
-
Key Traits:
-
Can be bullish or bearish.
-
-
Trading Tip: Use as a confirmation of trend strength.
33. Doji
The Doji indicates indecision, with open and close prices nearly identical.
-
Key Traits:
-
Reflects market uncertainty.
-
-
Trading Tip: Confirm with the next candle for direction.
34. Gravestone Doji
The Gravestone Doji forms at the top of a trend, signaling potential bearish reversal.

-
Key Traits:
-
Long upper wick with no lower wick.
-
-
Trading Tip: Enter short after confirmation.
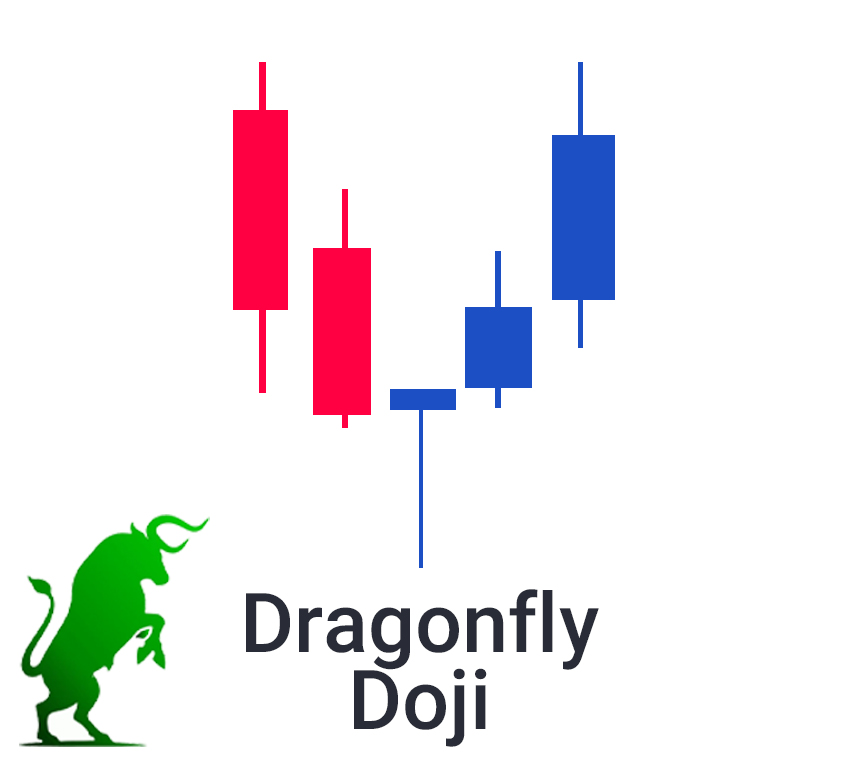
35. Dragonfly Doji
The Dragonfly Doji forms at the bottom of a trend, signaling potential bullish reversal.
-
Key Traits:
-
Long lower wick with no upper wick.
-
-
Trading Tip: Enter long after confirmation.
36. Long-Legged Doji
The Long-Legged Doji reflects high volatility and indecision with long wicks on both sides.
-
Key Traits:
-
Indicates potential reversal.
-
-
Trading Tip: Confirm direction with the next candle.
37. Bullish Spinning Top
The Bullish Spinning Top signals indecision during a downtrend, potentially reversing to bullish.

-
Key Traits:
-
Small body with wicks on both sides.
-
-
Trading Tip: Enter long after bullish confirmation.
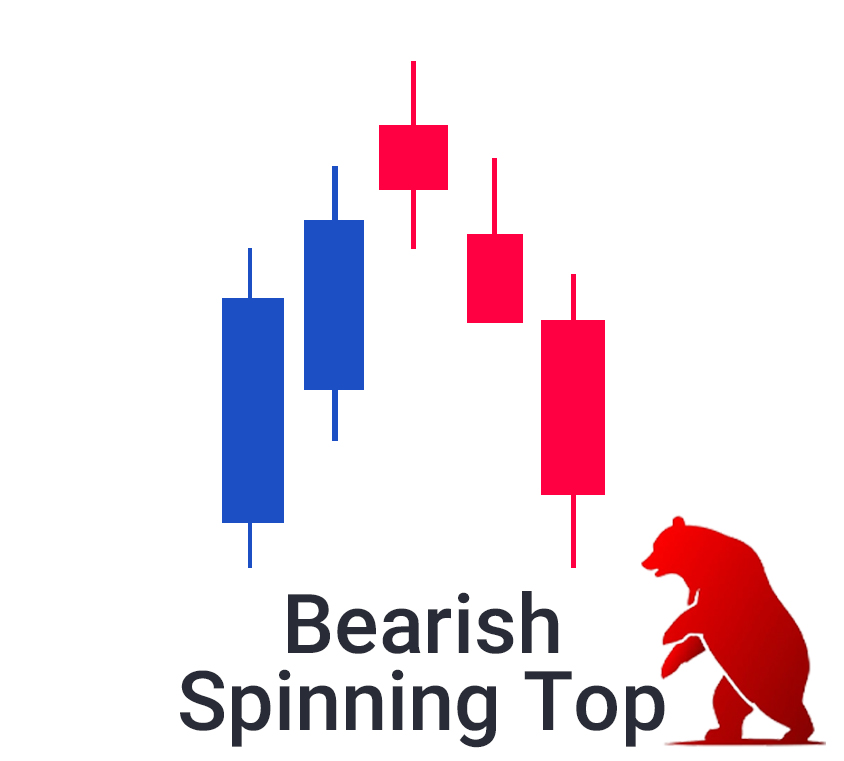
38. Bearish Spinning Top
The Bearish Spinning Top signals indecision during an uptrend, potentially reversing to bearish.
-
Key Traits:
-
Small body with wicks on both sides.
-
-
Trading Tip: Enter short after bearish confirmation.
39. Tri-Star
The Tri-Star consists of three consecutive doji candles, signaling a strong potential reversal.
-
Key Traits:
-
Indicates extreme indecision.
-
-
Trading Tip: Confirm reversal with the next candle’s direction.
40. Long Wicks
The Long Wicks pattern reflects rejection of extreme prices, signaling possible reversals.
-
-
Key Traits:
-
Long wicks on one or both sides of the candle.
-
-
Trading Tip: Wait for confirmation before trading in the opposite direction of the wick.
-
Read more: Pivot Points in Technical Analysis
How to Find Candlestick Patterns in a Chart?
Identifying candlestick patterns manually on charts can be time-consuming and prone to errors, especially in fast-moving markets. FXonbit’s Custom Candle Pattern Finder simplifies this process by providing an advanced, automated solution for both the crypto and forex markets. With cutting-edge technology, this service detects and highlights key candlestick patterns in real time, allowing traders to make informed decisions efficiently.

Check Our Custom Candlestick Patter Finder
FXonbit Custom Candle Pattern Finder Services
FXonbit offers a powerful Custom Candle Pattern Finder designed to cater to the needs of traders in the crypto and forex markets. This innovative tool helps traders effortlessly identify profitable opportunities by analyzing charts and detecting patterns automatically.
Start Our Crypto & Forex Dashboard For Free
Features of the Custom Candle Pattern Finder
-
Multi-Market Compatibility
-
Works seamlessly across cryptocurrency pairs (e.g., BTC/USDT, ETH/USD) and major forex pairs (e.g., EUR/USD, GBP/JPY).
-
-
Real-Time Pattern Detection
-
Identifies patterns such as Bullish Engulfing, Morning Star, Doji, and more as they form, providing traders with actionable insights instantly.
-
-
Customizable Alerts
-
Set personalized alerts for specific patterns or combinations to stay ahead of market movements.
-
-
Pattern Success Metrics
-
Provides historical success rates for identified patterns, helping traders assess their reliability and make data-driven decisions.
-
-
Integration with Trading Bots
-
Connect seamlessly with Your trading bots to automate strategies based on detected patterns.
-
-
Multi-Timeframe Support
-
Analyze patterns across various timeframes, from 1-minute charts for scalping to daily charts for swing trading.
-
-
User-Friendly Interface
-
Intuitive dashboard with clear visualizations makes it accessible to traders of all experience levels.
-

Why FXonbit’s Custom Candle Pattern Finder Will Help Traders
-
Time-Saving Efficiency
-
Eliminate the need for manual chart scanning and focus on executing trades.
-
-
Increased Accuracy
-
AI-driven detection ensures reliable identification of patterns, reducing the risk of false signals.
-
-
Enhanced Decision-Making
-
Historical success rates and real-time alerts provide traders with confidence in their strategies.
-
-
Improved Risk Management
-
Set precise stop-loss and take-profit levels based on identified patterns to minimize losses and lock in gains.
-
-
Versatility Across Markets
-
Whether you trade crypto, forex, or both, FXonbit’s tool adapts to your market preferences seamlessly.
-
-
Automation for Convenience
-
Integration with trading bots allows traders to automate their strategies and react to market conditions instantly.
-
-
Education and Insights
-
Learn from detected patterns and improve your trading knowledge over time, making you a more proficient trader.
-

Tips for Trading with Candlestick Patterns:
-
-
Use Confirmation Signals: Candlestick patterns alone can provide insights into market sentiment, but their reliability improves significantly when combined with confirmation signals. For instance:
-
Use Moving Averages to confirm the trend direction.
-
Apply the Relative Strength Index (RSI) to identify overbought or oversold conditions that align with the pattern.
-
Utilize Bollinger Bands to spot volatility and validate breakouts or reversals.
By relying on these tools, traders can reduce the risk of acting on false signals and enhance their decision-making process.
-
-
Combine Multiple Patterns: Instead of relying on a single candlestick pattern, look for a combination of patterns that align with each other. For example:
-
A Bullish Engulfing pattern followed by a Morning Star provides a stronger confirmation of an upward reversal.
-
A Bearish Harami paired with a Shooting Star reinforces the likelihood of a downward move.
When multiple patterns form in conjunction, they provide a clearer picture of market sentiment and improve the reliability of trade setups.
-
-
Consider Volume: Always analyze trading volume in conjunction with candlestick patterns. High volume accompanying a pattern like a Hammer or Shooting Star signals stronger conviction behind the move.
-
Adapt to Market Conditions: Understand the context in which the patterns appear:
-
In trending markets, continuation patterns like Rising Three Methods are more reliable.
-
In range-bound markets, reversal patterns like Doji or Engulfing are more effective.
Tailor your approach based on the prevailing market conditions to maximize success.
-
-
Read more: Trading the Head and Shoulders Pattern: A Complete Guide
How Candlestick Patterns Are Formed on a Chart?
Candlestick patterns are created by plotting the open, close, high, and low prices of an asset within a specific timeframe. The resulting candlestick consists of two main components:
- Body: Represents the range between the opening and closing prices.
– A green (or white) body indicates the price closed higher than it opened, signaling bullish sentiment.
– A red (or black) body indicates the price closed lower than it opened, reflecting bearish sentiment. - Wicks (Shadows): Extend from the body to show the highest and lowest prices during the period.
– A long upper wick suggests selling pressure, while a long lower wick indicates buying support.
This visual representation simplifies market analysis by allowing traders to quickly identify trends, momentum shifts, and potential reversals.
What Are the Types of Assets That Can Be Traded with Candlesticks?
Candlestick charts are versatile and can be applied across several asset classes. Here’s how they’re used in different markets:
1. Equity Trading with Candlesticks
Candlestick charts are invaluable for stock traders, enabling them to spot trends and predict potential price movements. Traders often use these charts to time their trades, identify resistance or support levels, and manage risks effectively.
- Example: On a Tesla chart, a Morning Star pattern may appear after a downtrend. This three-candle pattern signals a potential reversal, encouraging traders to consider long positions.
- Pro Tip: Combine candlestick patterns with indicators like moving averages or RSI for stronger confirmations.
2. Forex Trading with Candlesticks
Forex traders utilize candlestick charts to analyze currency pairs and predict price movements based on global economic events and market sentiment.
- Example: In a USD/JPY daily chart, a Bearish Harami pattern might signal a weakening uptrend and a potential reversal.
– Pro Tip: Use Fibonacci retracements alongside candlestick patterns to identify key entry and exit points.
3. Crypto Trading with Candlesticks
In the highly volatile cryptocurrency market, candlestick charts are essential for traders to analyze price action and spot opportunities.
- Example: A Bullish Abandoned Baby on a Bitcoin chart indicates a reversal, providing an excellent entry point for traders anticipating upward momentum.
– Pro Tip: Monitor volume alongside candlestick patterns to confirm the strength of a move.
How Candlestick Patterns Are Used Across Markets
Candlestick patterns offer universal insights across all trading markets. Whether you’re trading stocks, forex, or cryptocurrencies, these patterns help:
– Spot Trends: Understand if the market is trending upward, downward, or sideways.
– Identify Key Levels: Recognize areas of support and resistance.
– Manage Risks: Use patterns like the Hammer or Shooting Star to set precise stop-loss levels.
By combining candlestick analysis with other tools, such as technical indicators or trendlines, traders can gain a holistic understanding of market behavior and improve their decision-making.
Which Timeframe Is Best for Trading Candlesticks?
Choosing the right timeframe for trading candlesticks depends on your trading style and goals. For intraday traders, 5- to 15-minute timeframes are popular as they offer frequent opportunities to capitalize on quick price movements. However, these shorter timeframes often include more market noise, which can lead to less reliable signals.
For swing traders, 1-hour to 4-hour timeframes strike a balance between capturing broader market structures and identifying actionable setups. According to the “Swing Trading Market Analysis Report” by the International Financial Markets Association (IFMA), the 4-hour timeframe demonstrated a 70% success rate in identifying profitable trade setups.
Position traders and long-term investors may prefer daily or weekly charts, as these offer a clearer picture of overall trends and minimize the effects of intraday volatility. Experimenting with different timeframes is essential to find the best fit for your trading strategy.
Read more: What is advantages of FXonbit’s Forex Screener?
Why Are Candlestick Charts Important?
Candlestick charts provide a comprehensive visual representation of price action, combining the open, high, low, and close of a trading period into a single figure. This format allows traders to quickly interpret market sentiment, momentum shifts, and potential reversals.
A 2019 study by the Technical Securities Analysts Association found that traders using candlestick charts identified profitable opportunities 25% more often than those relying on basic line or bar charts. By condensing critical trading information into an easy-to-read format, candlestick charts simplify technical analysis and improve decision-making.
How to Combine Candlesticks with Other Technical Indicators?
Combining candlestick patterns with technical indicators enhances their reliability and accuracy. Here’s how:
-
Moving Averages: Use moving averages to identify dynamic support and resistance levels, confirming trend direction. For example, a Bullish Engulfing pattern near a rising 50-day moving average is a strong buy signal.
-
RSI: The Relative Strength Index helps verify overbought or oversold conditions. A Hammer pattern near oversold levels strengthens the reversal signal.
-
Bollinger Bands: These highlight periods of high or low volatility. A Shooting Star near the upper Bollinger Band often indicates a potential reversal.
-
VWAP: The Volume-Weighted Average Price is a valuable tool for intraday traders, providing insights into fair value zones.
A study by the Technical Analysis Society of America (TASA) found that combining candlestick patterns with indicators improved trade accuracy by an average of 20-25% across various markets.
In Which Market Conditions Are Candlesticks Most Effective?
Candlestick patterns excel in trending markets where strong momentum drives price action. Patterns like the Bullish Engulfing or Shooting Star are particularly reliable in markets moving with conviction. According to “Technical Analysis of the Financial Markets” by John J. Murphy, candlestick patterns achieve approximately 70% accuracy when used in trending conditions.
However, candlestick patterns are less effective in choppy or range-bound markets due to the lack of clear directional bias. False breakouts and invalidated patterns are more common in such conditions. To enhance their reliability, combine candlestick patterns with additional indicators, such as volume, moving averages, or momentum oscillators, to confirm the strength and validity of a pattern.
What Are the Limitations of Candlestick Patterns?
While candlestick patterns are powerful tools, they are not without limitations:
-
Range-Bound Markets: Candlestick patterns are less effective in consolidating markets where price movements lack clear direction.
-
Subjectivity: Different traders may interpret the same pattern differently, leading to inconsistent outcomes.
-
False Signals: Patterns often fail if there is insufficient momentum to sustain the expected move.
-
Need for Confirmation: Most patterns require subsequent price action to validate their signals, making standalone patterns unreliable.
To overcome these limitations, use candlestick patterns alongside complementary indicators, such as RSI or Bollinger Bands, for added confirmation and improved accuracy.
Are Candlestick Patterns Reliable?
Candlestick patterns are reliable when used appropriately and in the right context. Their effectiveness improves when combined with other tools, such as trendlines or moving averages. While no pattern guarantees success, candlestick patterns provide a solid foundation for technical analysis.
Certain chart types, like Heikin-Ashi or Renko charts, can sometimes enhance the reliability of candlestick patterns by smoothing out price noise. Ultimately, the success of candlestick analysis depends on the trader’s skill and understanding of market conditions.
What Is the 5-Min Candle Strategy?
The 5-minute candle strategy is a high-frequency trading technique that focuses on short-term price movements. Traders analyze 5-minute candlestick charts to identify quick patterns like Doji, Hammer, or Engulfing for intraday trades.
A study by Sahin and Akpinar found that a 5-minute candlestick strategy achieved an 11.8% average annual return, outperforming a traditional buy-and-hold approach. This strategy is ideal for traders who thrive in fast-paced environments and are skilled at managing quick decisions.
What Is the 3-Candle Rule?
The 3-candle rule identifies potential trade opportunities based on a sequence of three candles:
-
The first candle establishes the initial movement.
-
The second candle reverses that movement, creating potential uncertainty.
-
The third candle confirms the reversal, providing the signal to enter the trade.
A 2014 study published in the “Journal of Futures Markets” analyzed this rule in forex markets and found a 58% win rate across 30 currency pairs. The 3-candle rule is particularly useful for capturing short-term trend changes.
How to Learn Candlestick Patterns?
Mastering candlestick patterns requires consistent study and practice. Here are some effective learning methods:
-
Books: Read authoritative texts like “Japanese Candlestick Charting Techniques” by Steve Nison or “Encyclopedia of Candlestick Charts” by Thomas Bulkowski.
-
Online Courses: Enroll in courses offered by reputable trading academies to gain structured learning.
-
Research Papers: Explore academic studies analyzing the effectiveness of candlestick patterns.
-
Practice: Use demo accounts to identify and trade patterns in real-time without financial risk.
What Is the Success Rate of Candlestick Patterns?
On average, candlestick patterns have a success rate of 50-60% when used correctly. This success rate depends on factors such as the market’s trend, the trader’s expertise, and the pattern’s confirmation by other indicators.
Steve Nison’s analysis of major candlestick patterns on S&P 500 data revealed a 53.6% win rate over a 10-year period. This underscores the importance of using candlestick patterns as part of a broader strategy rather than in isolation.
Conclusion
In the realm of Forex and crypto trading, understanding candlestick patterns is an invaluable skill. These visual representations of price movements offer traders a unique perspective on market sentiment, helping them make more informed decisions. Whether you are a seasoned trader or a beginner, incorporating candlestick analysis into your trading strategy can significantly enhance your ability to navigate the complexities of the financial markets. As with any technical analysis tool, it’s crucial to combine candlestick patterns with other indicators and risk management strategies for a well-rounded approach to trading.