09 Mar

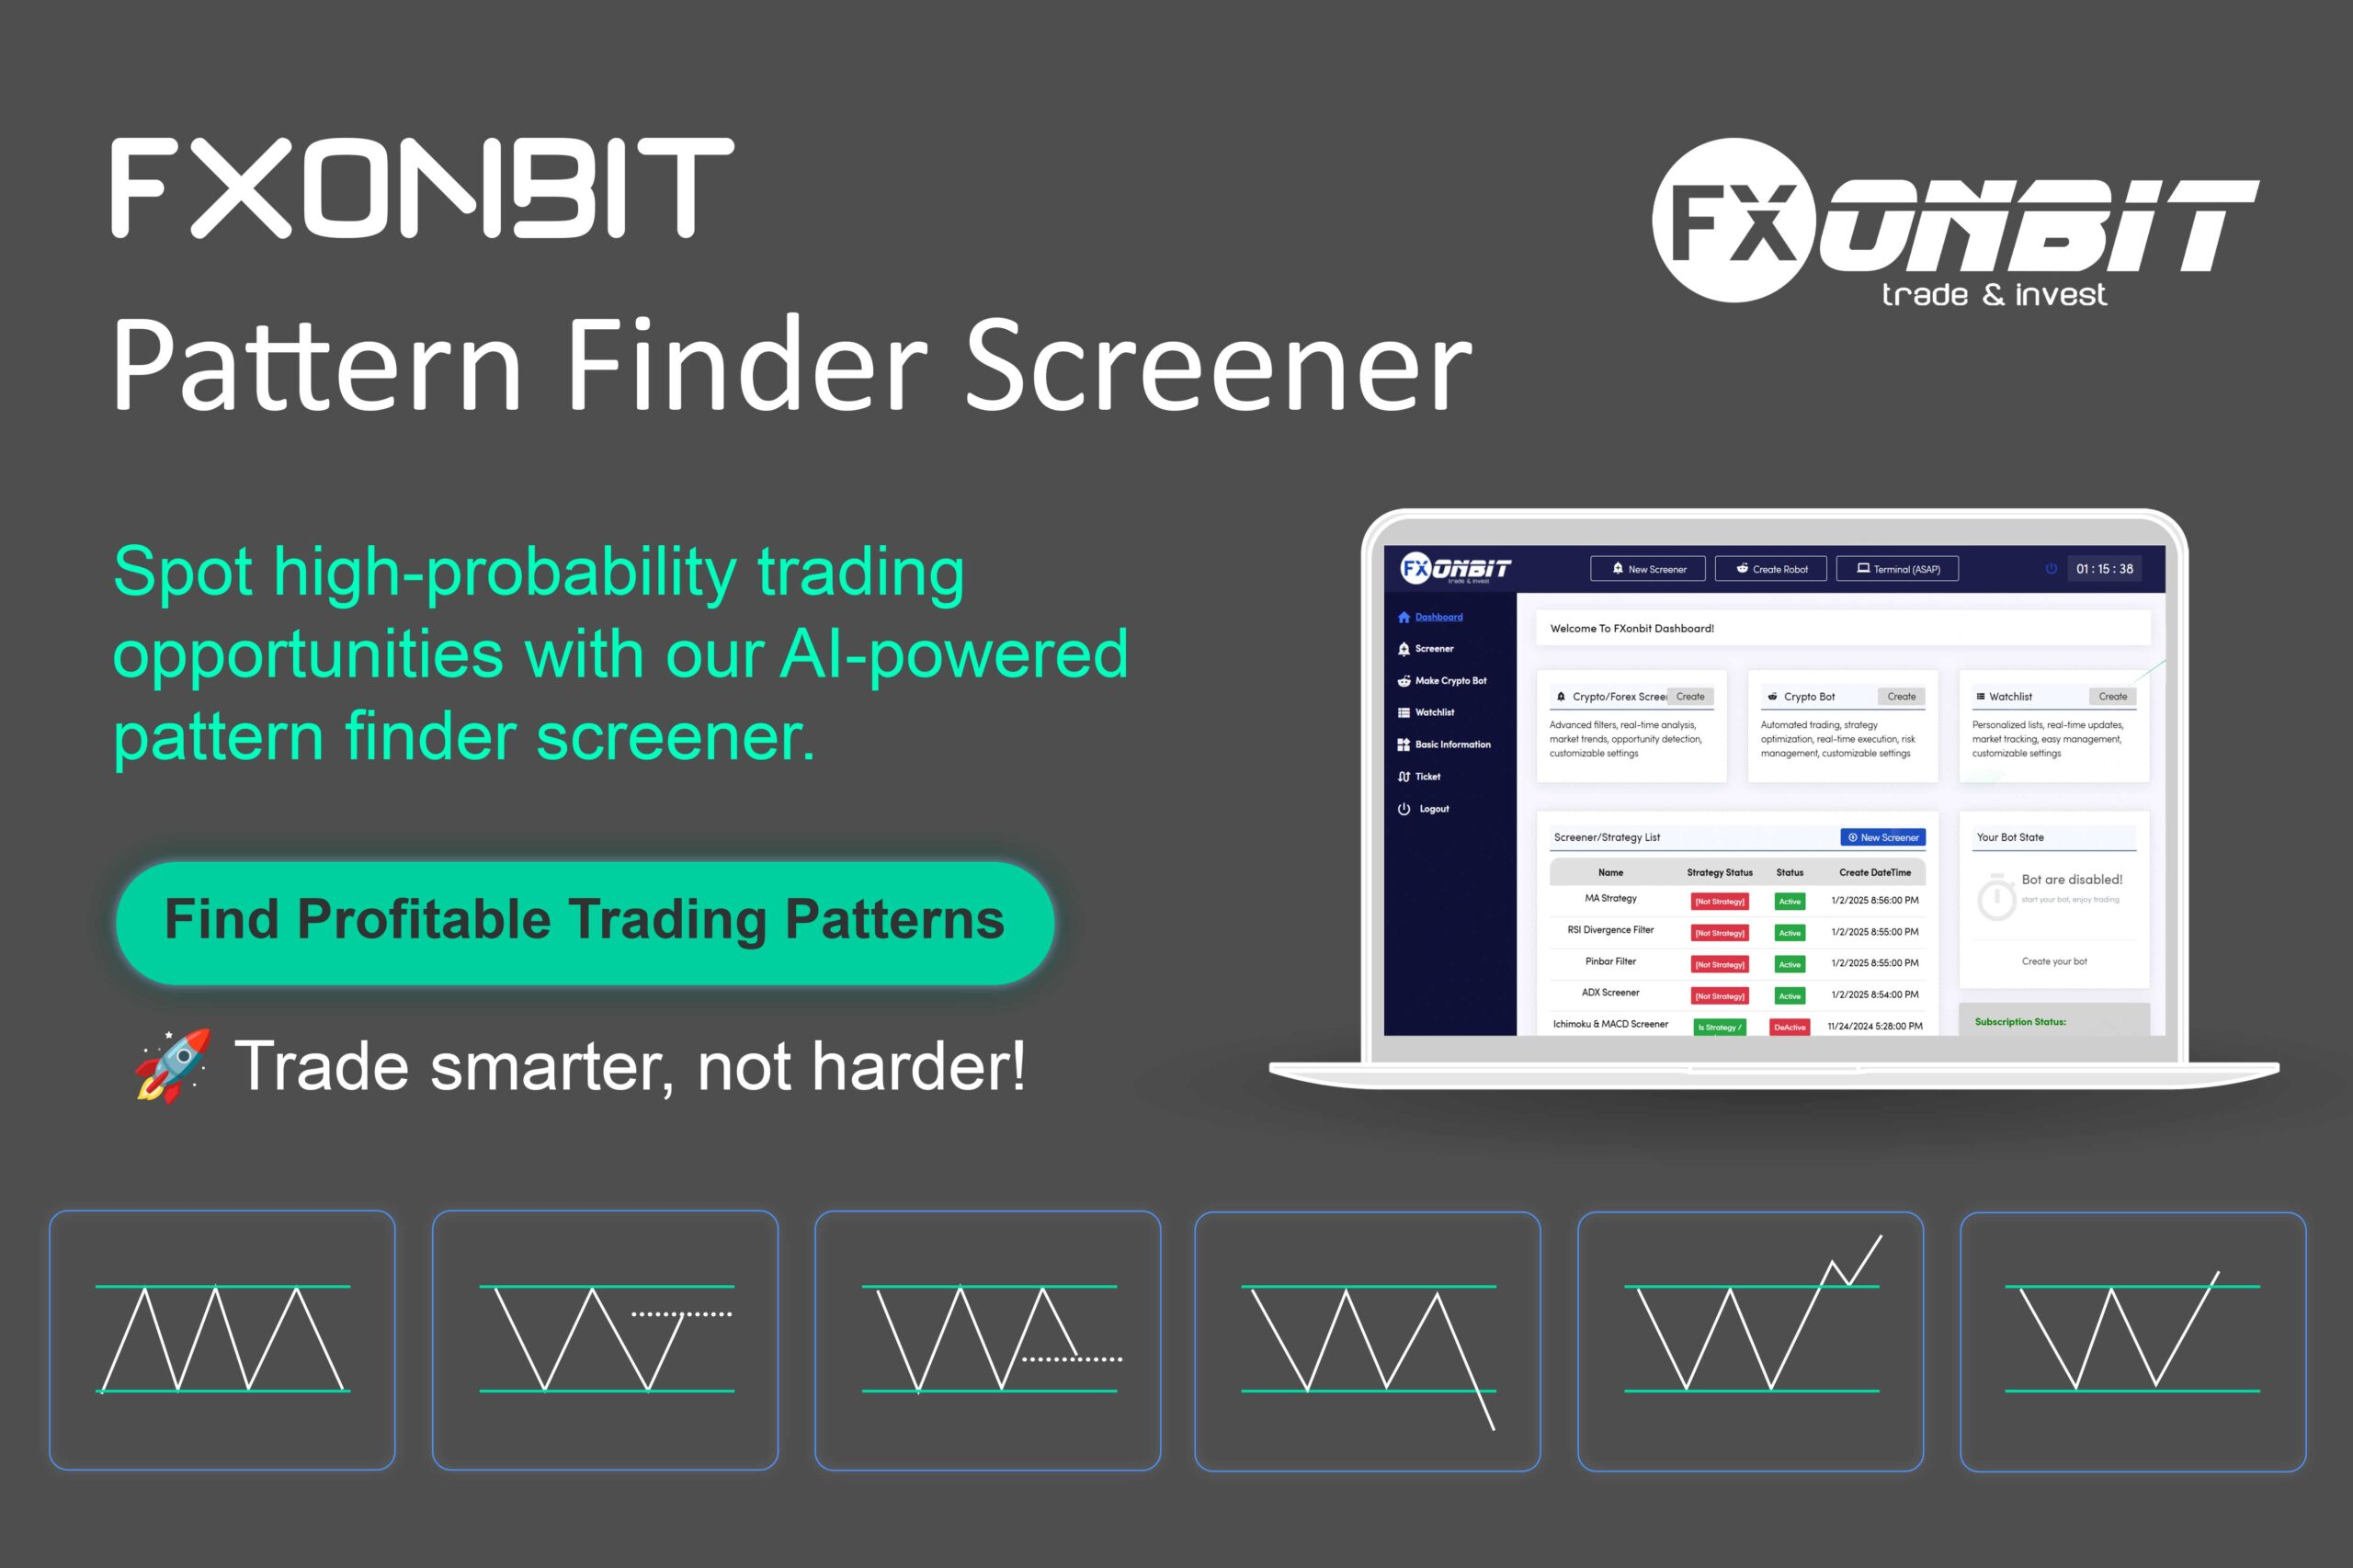
What is an Ascending Triangle Pattern?
An Ascending Triangle Pattern is a bullish continuation pattern that signals a potential breakout to the upside. It forms when the price repeatedly hits a horizontal resistance level at the top while making higher lows over time, creating an ascending trendline. This indicates that buyers are gaining strength, gradually pushing the price higher despite resistance.
Start Our Crypto & Forex Dashboard For Free
The pattern suggests a period of consolidation before a breakout occurs. Once the price breaks above the resistance level with strong volume, it often leads to a significant upward movement. Traders use this pattern in forex, stocks, and cryptocurrency trading to anticipate bullish trends.
Explore more: Symmetrical Triangle Pattern: A Powerful Price Action Signal
Key Characteristics of an Ascending Triangle Pattern
These key characteristics define an Ascending Triangle Pattern and help traders identify potential breakout opportunities:
- Horizontal Resistance Line – The upper boundary remains flat, indicating a strong resistance level where sellers repeatedly prevent price movement above a certain point.
- Rising Trendline (Higher Lows) – The lower boundary trends upward, showing that buyers are steadily gaining control by pushing prices higher despite resistance.
- Volume Behavior – Volume typically decreases as the pattern develops, reflecting market indecision, but surges when a breakout occurs, confirming the move.
- Breakout Direction – In most cases, the price breaks above the resistance level, signaling a bullish continuation and the potential for further upward movement.
This pattern is widely used in forex, stocks, and cryptocurrency trading to anticipate strong bullish trends.
Read More: Trading Chart Patterns: What Are Chart Patterns? + PDF
How to Identify an Ascending Triangle
To accurately identify an Ascending Triangle Pattern on a price chart, follow these steps in detail:
1. Identify a Strong Horizontal Resistance Level
- Look for a price level that the market has tested multiple times but failed to break above.
- This resistance level remains relatively flat, meaning sellers are consistently preventing further price increases at this point.
- The more times the price tests this level without breaking, the stronger the resistance becomes.
2. Look for Higher Lows (Rising Trendline)
- Identify higher lows forming over time, showing that buyers are becoming more aggressive.
- Each low should be higher than the previous one, indicating that buyers are stepping in earlier and pushing prices up.
- This creates an ascending trendline, which shows increasing buying pressure.
Explore more: Advanced Technical Analysis: Using Divergences and Convergences for Precision Trading
3. Draw the Ascending Triangle
- Use trendlines to connect the resistance level (flat line) and the higher lows (ascending line).
- The price movement should resemble a triangle, with the two lines converging toward the resistance level.
4. Observe Volume Behavior
- Decreasing volume during the formation of the triangle suggests market consolidation, meaning traders are waiting for a breakout.
- Surging volume at the breakout point confirms strong buying interest and increases the likelihood of a sustained move.
5. Confirm the Breakout
- The pattern is confirmed when the price breaks above the resistance level with strong momentum.
- Ideally, the breakout should occur with high volume, as this increases the probability of a successful continuation.
- Traders often look for a retest of the resistance-turned-support level before entering a trade to ensure the breakout is valid.
By following these steps, traders can accurately identify and trade the Ascending Triangle Pattern, improving their chances of catching bullish breakouts in forex, stocks, and cryptocurrency markets.

Read more: Trading the Head and Shoulders Pattern: A Complete Guide
Trading Strategies for the Ascending Triangle Pattern
When trading an Ascending Triangle Pattern, following a structured approach can help maximize profits and manage risks effectively.
1. Entry Point – When to Enter a Trade
You can enter a trade in two primary ways:
A. Buy on Breakout
- Enter a long position when the price breaks above the resistance level with strong volume.
- A confirmed breakout typically occurs when a candle closes above the resistance level rather than just briefly crossing it.
- High trading volume during the breakout increases the likelihood of a strong continuation.
B. Retest Confirmation (Safer Entry)
- Some traders prefer to wait for a pullback after the breakout.
- If the old resistance turns into a new support level, it confirms the breakout’s validity.
- Enter the trade once the price successfully retests the breakout level and starts moving upward again.
2. Stop-Loss Placement – Managing Risk
Setting a stop-loss is essential to protect against false breakouts and market reversals.
A. Stop-Loss Below the Most Recent Higher Low
- Place your stop-loss slightly below the most recent higher low within the triangle.
- This prevents premature exits caused by minor price fluctuations.
B. Stop-Loss Below the Lower Trendline
- A more conservative stop-loss placement is just below the ascending trendline.
- If the price breaks below this line, it indicates a failed pattern or reversal.
3. Take Profit Target – Maximizing Gains
Profit targets help traders plan when to exit a trade after entering.
A. Measure the Triangle’s Height
- Take the vertical distance between the resistance level and the lowest point of the triangle.
- Project this distance upward from the breakout point to estimate the price target.
- This method works well when price action respects technical patterns.
B. Use Previous Resistance Levels or Fibonacci Extensions
- Identify past resistance levels as possible profit-taking zones.
- Use Fibonacci extensions (e.g., 1.618 level) to predict further price movement.
- These methods help when the market moves unpredictably beyond the measured target.
Key Considerations
✔ Watch for False Breakouts – If the breakout lacks volume, it might be a trap.
✔ Confirm with Indicators – RSI, MACD, or Moving Averages can strengthen your trade setup.
✔ Risk-Reward Ratio – Aim for at least a 2:1 reward-to-risk ratio to ensure profitable trades over time.
By applying these strategies, traders can take advantage of the Ascending Triangle Pattern with higher accuracy and lower risk in forex, stock, and crypto markets. 🚀
Example of an Ascending Triangle Pattern
Scenario Breakdown:
- Initial Price Movement:
- A stock is trading at $50, with a strong resistance level at $55.
- This means sellers are consistently preventing the price from moving above $55.
- Formation of Higher Lows (Rising Trendline):
- The stock forms higher lows at $48, $50, and $52, showing that buyers are steadily pushing the price up.
- This upward pressure signals growing bullish momentum despite the resistance.
- Breakout Above Resistance:
- After multiple failed attempts, the price finally breaks above $55 with a high-volume surge.
- This breakout confirms that buyers have overpowered sellers, indicating a potential upward continuation.
- Trade Execution:
- A trader enters a long position at $56, right after the breakout is confirmed.
- Stop-loss placement: The trader sets a stop-loss at $52, slightly below the most recent higher low, to minimize risk.
- Take profit target:
- The triangle’s height is measured as $55 (resistance) – $50 (lowest point) = $5.
- This height is projected upward from the breakout level ($55), setting a target price of $60 ($55 + $5).
Explore more: What is Crypto Screener? The Best Crypto Screener

Key Takeaways from This Trade:
✔ Strong confirmation of the pattern – Higher lows and multiple resistance tests strengthen reliability.
✔ Volume surge on breakout – Indicates strong buying pressure and reduces the risk of a false breakout.
✔ Well-defined entry, stop-loss, and take-profit – Ensures disciplined risk management.
By following this structured approach, traders can effectively capitalize on bullish breakouts using the Ascending Triangle Pattern in stocks, forex, and crypto markets. 🚀
Psychology Behind the Pattern 🧠
- The higher lows indicate that buyers are becoming increasingly aggressive.
- The flat resistance shows that sellers are still holding strong, but they are slowly losing control.
- As buying pressure builds up, a breakout becomes inevitable, leading to a strong price surge.
Read more: Bullish Rectangle Pattern: A Trader’s Complete Guide
Timeframe Considerations ⏳
- Shorter timeframes (5m, 15m, 1H): More breakouts fail due to market noise.
- Higher timeframes (4H, Daily, Weekly): More reliable patterns with stronger breakouts.
- Best approach: Combine multiple timeframes to confirm the pattern.
Indicators to Strengthen the Setup 📊
- RSI (Relative Strength Index):
- A rising RSI above 50-60 confirms buying strength.
- Overbought levels (above 70) could indicate a temporary pullback.
- MACD (Moving Average Convergence Divergence):
- A bullish crossover (MACD line crossing above the signal line) supports the breakout.
- Moving Averages (50 EMA / 200 EMA):
- If price stays above key EMAs, the trend remains strong.
Explore more: Crypto Whale Tracker Guide: How to Follow the Biggest Players in the Market
Limitations and False Breakouts
- False Breakouts: Sometimes, price may temporarily break above resistance and then drop back below.
- Extended Consolidation: If the pattern lasts too long, it may lose its effectiveness.
- Downside Breakouts: Though rare, price can break below the ascending trendline, leading to a bearish move.
To minimize risks, traders should use confirmation indicators like RSI, MACD, and volume analysis before executing trades.
Explore more: What is MACD? Full Guidance
False Breakouts and How to Avoid Them 🚨
- Not every breakout leads to a sustained uptrend.
- Signs of a false breakout:
- Price briefly moves above resistance but closes back below.
- Low trading volume on the breakout.
- Sudden reversal with strong bearish candles.
- How to avoid false breakouts:
- Wait for a daily close above the resistance.
- Look for volume confirmation (higher-than-average volume).
- Consider waiting for a retest of the breakout level.
Conclusion
The Ascending Triangle Pattern is a powerful tool for traders seeking to capitalize on bullish breakouts. By correctly identifying the pattern, placing strategic stop-loss orders, and setting profit targets, traders can enhance their market performance. However, proper risk management and confirmation signals are essential to avoid false breakouts.
Mastering this pattern can provide traders with an edge in technical analysis and market decision-making. Keep practicing with real-time charts and backtesting strategies to refine your trading approach!
Final Thought: Why Traders Love This Pattern
✔ High Success Rate: One of the most reliable bullish continuation patterns.
✔ Clear Structure: Easy to spot with defined entry, stop-loss, and target levels.
✔ Versatile: Works in forex, stocks, crypto, and commodities markets.
Hi, I’m Asena, a Senior Marketing Specialist with over 8 years of experience and a deep passion for trading knowledge. I have a genuine fascination with the world of Crypto and Forex markets. Over the past 6 years, I’ve dedicated myself to writing about technical analysis, fundamental analysis, and the intricate dynamics of these markets. My mission is to provide the most complete and comprehensive data to empower my audience with actionable insights. I truly love what I do and constantly strive to deliver the best possible results for my readers and users.
Asena Taremi