03 Jan

The Bump and Run pattern is a significant chart pattern that signals potential trend reversals in financial markets, including forex, stocks, and cryptocurrencies. This pattern typically forms after a steep price movement and is categorized into two phases: the Bump Phase and the Run Phase. Understanding and identifying this pattern can help traders anticipate market trends and make informed trading decisions.
Start Our Crypto & Forex Dashboard For Free

Read more: FXonbit CandleStick Pattern Finder Service: Your Gateway to Smarter Forex and Crypto Trading
What is Bump and Run?
The Bump and Run pattern is a reversal chart pattern that starts with a steep price rise or fall (Bump Phase) and transitions into a reversal trend (Run Phase). It is often seen in overbought or oversold conditions, signaling that the market is ready to correct or reverse its direction.
Read More: Trading Chart Patterns: What Are Chart Patterns? + PDF

How to Identify the Bump and Run Pattern?
To accurately identify the Bump and Run pattern, traders should focus on its two key phases:
1. Bump Phase
The Bump Phase occurs when the price moves sharply away from its trendline due to excessive speculation or overbuying/selling.
Key Characteristics of the Bump Phase:
- Steep Price Movement: The price deviates significantly from the established trendline, creating a steep slope.
- Volume Surge: A noticeable increase in trading volume accompanies this phase, indicating heightened market activity.
- Overbought/Oversold Levels: Oscillators like RSI often show extreme readings during this phase.
How to Identify the Bump Phase on the Chart:
- Draw a trendline along the initial trend.
- Observe for a sharp price rise or drop that significantly deviates from the trendline, creating the “bump.”
- Confirm with increased trading volume.
Chart: Descending Broadening Wedge Definition & Trading Strategy

Read more related: Drawdown and Maximum Drawdown in Forex
2. Run Phase
The Run Phase begins after the sharp price movement reverses and the price breaks below or above the original trendline, depending on the direction of the pattern.
Key Characteristics of the Run Phase:
- Trendline Breakout: The price crosses the initial trendline, signaling the start of the new trend.
- Sustained Movement: The price continues to move in the new direction, forming the “run.”
- Decreasing Volume: Trading volume typically stabilizes or decreases as the new trend takes shape.
How to Identify the Run Phase on the Chart:
- Watch for the price to break the trendline established during the bump phase.
- Confirm the new trend direction with additional candlesticks and lower volume.
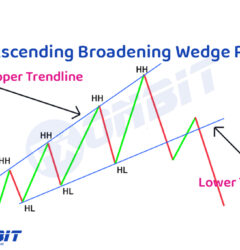
Read this Chart Pattern: Ascending Broadening Wedge: A Comprehensive Guide for Traders

Types of Bump and Run Patterns
The Bump and Run pattern can be classified into two main types:
1. Bullish Bump and Run
- Formation: Occurs after a steep price drop (bump), followed by a reversal and an upward breakout (run).
- Signal: Indicates a bullish trend reversal, signaling buying opportunities.
- Example: A currency pair falls sharply, then breaks above its trendline and starts an upward rally.
Read more: Weighted Moving Average (WMA): A Comprehensive Guide for Traders
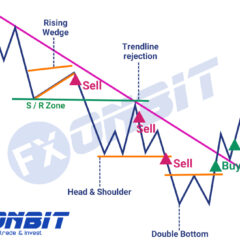
2. Bearish Bump and Run
- Formation: Happens after a sharp price rise (bump), followed by a downward breakout (run).
- Signal: Suggests a bearish trend reversal, signaling selling opportunities.
- Example: A stock experiences a rapid climb, then breaks below its trendline and begins a downward trend.
Read more: What is Forex Screener? Free Trading Opportunities with a Comprehensive Tool
What Do the Bump and Run Pattern Tell Traders?
The Bump and Run pattern offers critical insights into market dynamics:
- Market Exhaustion: The bump phase reflects excessive speculation, leading to overbought or oversold conditions.
- Reversal Signals: The run phase confirms a trend reversal, offering traders an opportunity to enter new positions.
- Trend Identification: It helps traders recognize when the market is transitioning from one trend to another.
Explore more: What is Crypto Screener? The Best Crypto Screener
Read more: On-Balance Volume (OBV): A Complete Guide for Traders
How to Trade the Bump and Run Chart Pattern?
Trading the Bump and Run pattern requires patience and confirmation to avoid false signals. Here’s a step-by-step guide:
1. Identify the Pattern
- Use trendlines to spot the steep price movement (bump) and wait for the breakout (run).
- Confirm the pattern with volume analysis and technical indicators like RSI or MACD.
Explore more: What is MACD? Full Guidance
2. Wait for the Breakout
- For a bullish pattern: Enter a buy position after the price breaks above the trendline.
- For a bearish pattern: Enter a sell position after the price breaks below the trendline.
3. Set Stop-Loss
- Place the stop-loss just below the lowest point of the bump for a bullish pattern.
- Place the stop-loss just above the highest point of the bump for a bearish pattern.
4. Set Take-Profit Levels
- Measure the height of the bump from the trendline and project it in the breakout direction to determine your take-profit level.
5. Monitor the Run Phase
- Use trailing stops to lock in profits as the trend progresses.
- Exit the trade if the price shows signs of reversal or loss of momentum.
Read this: A Comprehensive Guide to Hedging in Forex and Finance
Read this Chart Pattern: Bullish Rectangle Pattern: A Trader’s Complete Guide
The End
The Bump and Run pattern is a reliable tool for identifying trend reversals and trading opportunities in volatile markets. By understanding its phases and types, traders can anticipate market movements and execute informed trades.
Read more: Maximize Your Crypto Profits with a Crypto Screener
Key Takeaways:
- The Bump Phase represents a steep deviation from the trendline due to market speculation.
- The Run Phase confirms the reversal as the price breaks the trendline and establishes a new trend.
- Combining this pattern with volume analysis and technical indicators enhances its accuracy.
Mastering the Bump and Run pattern can give traders a significant edge in navigating trend reversals, making it an essential addition to any trader’s toolkit.
Chart Pattern: How to Trade the Ascending Channel?

Hi, I’m Asena, a Senior Marketing Specialist with over 8 years of experience and a deep passion for trading knowledge. I have a genuine fascination with the world of Crypto and Forex markets. Over the past 6 years, I’ve dedicated myself to writing about technical analysis, fundamental analysis, and the intricate dynamics of these markets. My mission is to provide the most complete and comprehensive data to empower my audience with actionable insights. I truly love what I do and constantly strive to deliver the best possible results for my readers and users.

Asena Taremi