
04 Jan
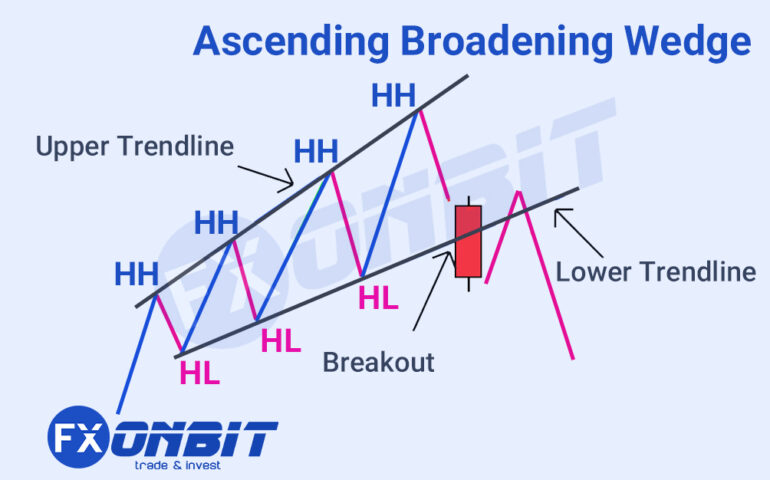
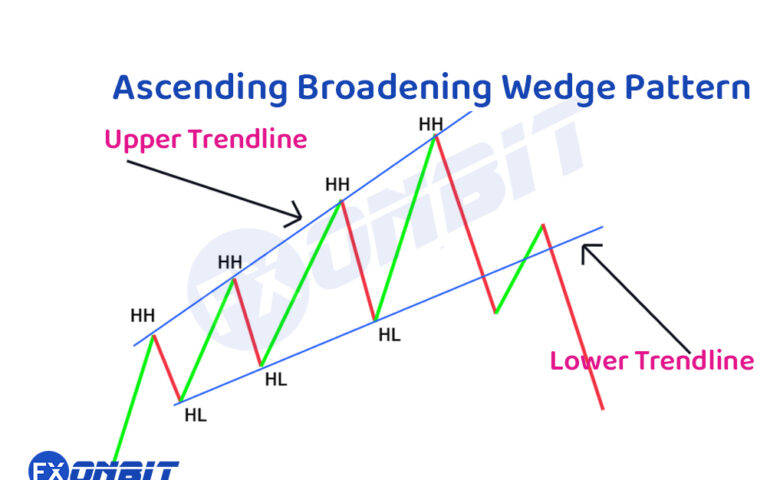
Ascending Broadening Wedge: A Comprehensive Guide for Traders
The Ascending Broadening Wedge is a key chart pattern in technical analysis that helps traders identify potential trend reversals or continuation scenarios (known for signaling potential bearish reversals during an
03 Jan
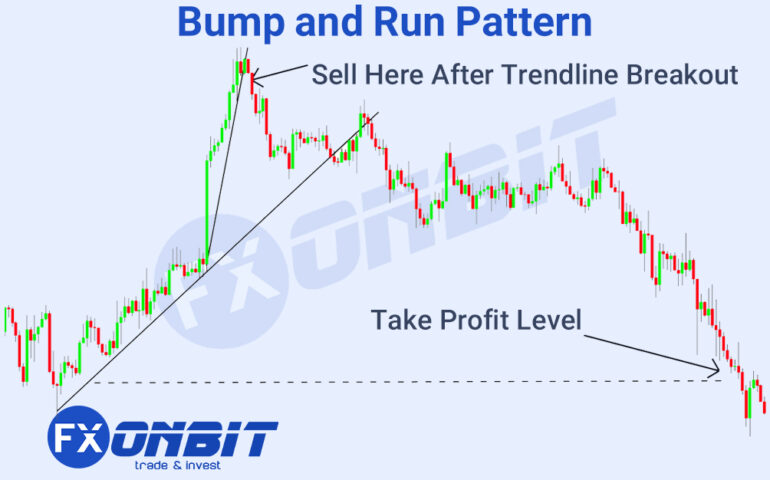
Bump and Run Pattern: A Comprehensive Guide
The Bump and Run pattern is a significant chart pattern that signals potential trend reversals in financial markets, including forex, stocks, and cryptocurrencies. This pattern typically forms after a steep
03 Jan
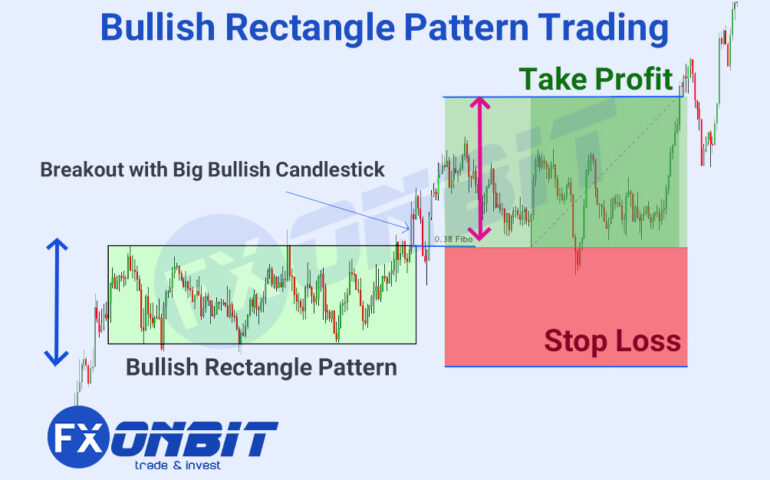
Bullish Rectangle Pattern: A Trader’s Complete Guide
The bullish rectangle pattern is a powerful chart pattern used by traders to identify potential price continuations or reversals in the market. It is formed during periods of consolidation when
31 Dec

Bearish and Bullish Megaphone Patterns
In the world of technical analysis, chart patterns play a vital role in forecasting price movements. Among the plethora of patterns, the Bearish and Bullish Megaphone Patterns stand out for
30 Dec
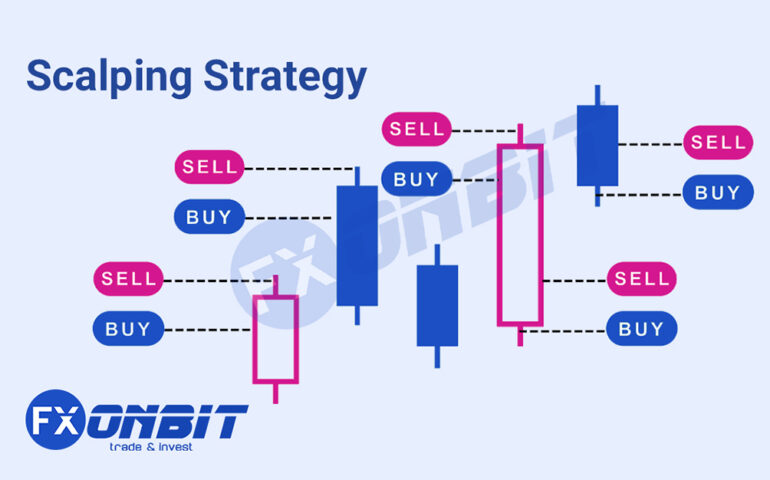
What is Scalp Trading and How to Use Algo Trading for Scalping
What is Scalp Trading? Scalp Trading is a short-term trading technique where traders execute numerous small trades within a day to profit from minor price fluctuations. Unlike swing or position
24 Dec
Trading Chart Patterns + PDF: What Are Chart Patterns?
Chart patterns are visual representations of price movements on a trading chart that help traders predict future market behavior. By analyzing these patterns, traders can identify potential trend reversals, continuations,