02 Dec

What is a Breakout?
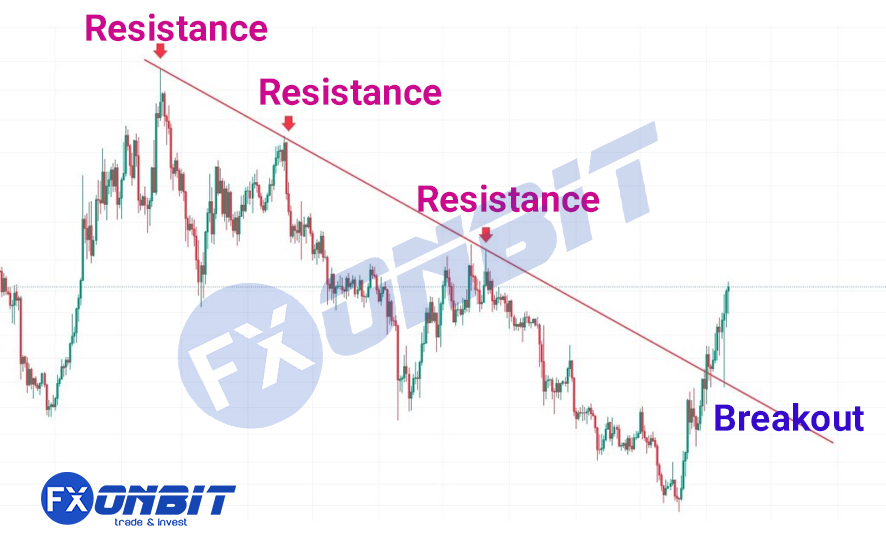
A breakout in technical analysis and financial markets refers to a situation where the price of an asset surpasses a fixed resistance or support level and enters a new range. This typically occurs after a period of consolidation or horizontal movement. Breakouts indicate a shift in market trends, often leading to significant price fluctuations.
Read more: FXonbit CandleStick Pattern Finder Service: Your Gateway to Smarter Forex and Crypto Trading
When a breakout happens, it can signify the start of a new bullish or bearish trend. For example, if the price breaks above a resistance level, it suggests potential future price increases. Conversely, if the price breaks below a support level, a price decline may follow. Traders take advantage of these situations by entering the market at the breakout point to capitalize on the new trend.
Read More: Top 10 Forex Trading Strategies for Consistent Profits

Breakout in Trading
Breakouts can be triggered by various factors, including increased trading volume, economic news, or fundamental changes in companies or countries. Traders use technical charts and indicators to identify and confirm breakouts, aiming to reduce trading risks.
Read More: Trading Chart Patterns: What Are Chart Patterns? + PDF
Resistance Breakout
A resistance breakout occurs when the price surpasses a resistance level. This is often followed by a surge in trading volume and increased price volatility.
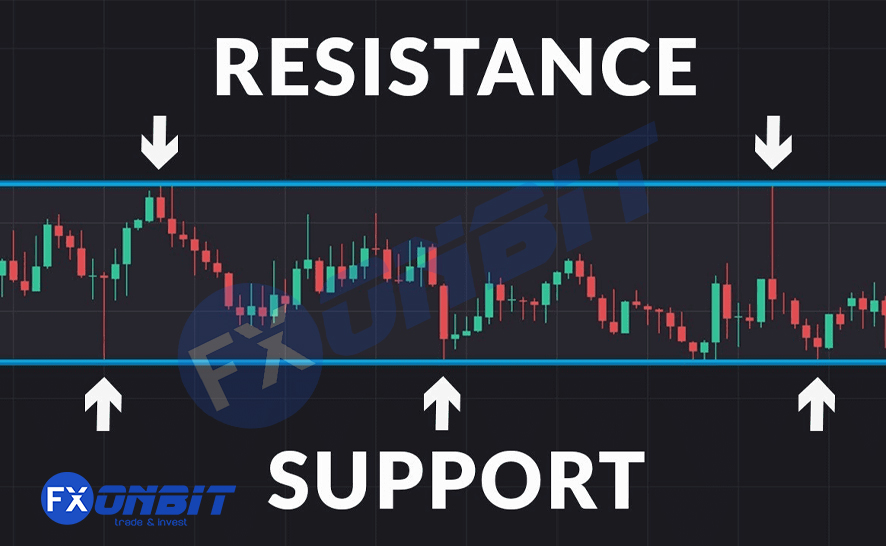
What is Resistance?
Resistance is typically a specific price level where the supply of an asset exceeds market demand, creating a saturation point that prevents the price from rising further.
Read more: Crypto Scalp Trading: Basic Guide

Break and Conversion of Support and Resistance Levels
One very important point in the market is that support and resistance levels are never static, and there is always the possibility that these levels can convert into each other. This event is considered one of the best occurrences in the market. When a support level breaks and turns into a resistance level, or vice versa, when a resistance level breaks and becomes a support level, it signals a significant trading confirmation in the market.
To understand this more clearly, it can be said that shareholders, based on both fundamental and technical factors of an asset, and the overall market trend, may realize that the asset’s value is higher than its current price. In this situation, not only do shareholders decide to sell their asset, but more buyers also become interested in it. As a result, the asset (stock or cryptocurrency) surpasses its previous price and breaks through its technical resistance level.
On the other hand, there may be situations where sellers realize that the asset they own is worth less than its current market price. In this case, not only does the shareholder wish to sell, but no buyers are willing to purchase it. In such conditions, the asset breaks its support level, and the price drops below that support.
Explore more: Top Indicators in Crypto Screeners for Effective Trading

Why do support and resistance levels form?
As you know, the price of an asset is always in a struggle between the seller and the buyer.
Buyers, by applying pressure to the market, can increase the price of a stock, while sellers can decrease the price by exerting pressure. As mentioned earlier, support and resistance levels form as a result of the pressure exerted by buyers or sellers on the price of an asset.
The process of price determination in the market is like a battle between sellers and buyers, which leads to the formation of support and resistance points. Ultimately, the price is determined in a struggle between supply and demand, between sellers and buyers. In the end, sellers and buyers reach an agreement on the price of an asset at a specific point, and the transaction is completed.
Explore more: Volume Analysis for Day Traders: How to Maximize Profits
Explanation of Resistance Breakout
A resistance breakout can be an excellent trading opportunity. Professional traders monitoring market behavior to identify patterns near resistance levels often buy the asset above resistance or below support lines.
A resistance breakout is typically characterized by surpassing resistance levels and unprecedented price increases. Once the resistance level is broken, the previous peak usually acts as a support level during price corrections.
Reasons for Resistance Breakout
Market resistance is usually overcome by increased demand, leading to rapid price growth. Resistance breakouts often occur under anticipated conditions. For example, when the price fluctuates within a specific range and approaches the upper limit of the range, savvy traders prepare for a breakout to maximize trading profits.
These traders look for specific patterns, such as triangles, flags, and head-and-shoulders, to pinpoint resistance levels and closely monitor price movements near these areas. Resistance breakouts can also result from significant news or events, though predicting these breakouts can be challenging.
How to Trade Resistance Breakouts
Trading resistance breakouts is most effective when the market indicates a long-term bullish trend. Investors following this strategy identify resistance levels and monitor price movements and trading volumes near these levels.
When the price approaches resistance with high trading volume, the breakout is confirmed, prompting the opening of a long position. After breaking through the resistance level and rising, a short-term price correction often occurs to balance supply and demand. Experienced traders usually enter during the correction and set their stop-loss slightly below the resistance level.
How to Trade Using Support and Resistance Levels
If you plan to trade using support and resistance levels in various financial markets, such as stocks, cryptocurrencies, or even Forex, you might be wondering how to effectively incorporate these levels into your trading strategy.
There are several methods you can use to trade with support and resistance points.
For example:
1. Enter a Long (Buy) or Short (Sell) Position
In this strategy, also known as the Breakout Strategy, you can enter a trade when the price moves above a support level. When you notice that the price is approaching a support zone, you can open a long position and take advantage of the anticipated upward movement. Similarly, you can use resistance levels. In this case, you enter the market below a resistance level, and when the price approaches the resistance zone, you open a short position. In this range, the price is likely to move downward.
2. Set a Stop-Loss
Setting a stop-loss below the support level (for a long position) or above the resistance level (for a short position) helps limit your loss if the price moves against you. For example, if the price moves downward instead of upward (or vice versa), your stop-loss will help limit the loss. Experienced traders often recommend entering and exiting trades near support or resistance levels. However, it’s essential to consider all factors beforehand to ensure a reasonable risk-to-reward ratio, clear trade objectives, and a sensible stop-loss strategy.
3. Exiting a Long Position at Resistance
If, for any reason, the asset you’re trading repeatedly tests a resistance level but fails to break through, you can use that resistance level as a signal to exit your long position. When the price repeatedly touches resistance but fails to break it, it often suggests that the asset might face a reversal or a decline. Therefore, exiting your position near resistance can be a strategic move to lock in profits and avoid potential losses.
Important Reminder
All these methods work best when you correctly identify and draw your support and resistance levels. If these levels are drawn incorrectly, your analysis will be flawed, and you may end up with losses. Therefore, precise level identification is crucial to making informed and successful trades.
Steps of a Breakout
A breakout strategy is a crucial method in forex and financial markets, helping traders identify moments when asset prices breach key levels, such as support or resistance. Traders use these levels to plan their entry and exit points, typically targeting breakouts accompanied by increased trading volume. This volume surge indicates strong interest and activity at these levels. A clear breakout often leads to price movement in the breakout’s direction.
Steps in the Breakout Strategy:
1. Select the Asset or Currency Pair: Choose the financial asset or currency pair you want to trade. Pairs with high trading volumes, such as EUR/USD, GBP/USD, or USD/JPY, are often preferred due to their volatility and trading opportunities.
2. Analyze the Chart and Identify Key Levels: Analyze the asset’s price chart to determine support and resistance levels. Support is where prices tend to stop falling, and resistance is where they stop rising. Breakouts usually occur when prices cross these levels.
3. Wait for the Breakout: A breakout happens when the price breaks above resistance and moves upward or below support and moves downward. Increased trading volume confirms genuine breakouts rather than fake ones.
4. Enter the Trade: Once the breakout is confirmed, enter the trade. A breakout above resistance suggests a long (buy) position, while a breakout below support suggests a short (sell) position.
5. Manage the Trade: After entering the trade, set stop-loss and take-profit orders to manage risks and lock in profits. These settings ensure a clear risk management plan for exiting the trade.
6. Exit the Trade: Manage the trade based on market conditions. Exit when the price hits your target or moves unfavorably, minimizing losses or securing profits.
Types of Breakouts
Breakouts in technical analysis are categorized into Bullish Breakout, Bearish Breakout, and Fake Breakout:
1. Bullish Breakout:
Occurs when the price surpasses a resistance level, indicating the start of a new uptrend.
Signs:
• Price moves above the resistance level.
• Increased trading volume.
• Confirmation by technical indicators like RSI or momentum.
2. Bearish Breakout:
Happens when the price breaks below a support level, indicating the beginning of a downtrend.
Signs:
• Price drops below the support level.
• Increased trading volume.
• Decline in indicators such as RSI.
3. Fake Breakout:
Occurs when the price briefly crosses a key level but quickly returns to its previous range. This can mislead traders and result in losses.
Signs:
• Breakout without confirmation by volume.
• Quick price reversal to previous levels.
• Lack of sustained movement in the breakout direction.
How to Identify Support and Resistance Levels
Now that we are familiar with support and resistance zones in technical analysis and understand why these points form and their types, the important question is how to identify these levels and ultimately use them in technical analysis.
All professional traders know that correctly identifying support and resistance levels can prepare them for a successful trade.
They use various methods to identify these levels. Here are a few common methods for identifying support and resistance levels:
◾ One of the most important ways to identify resistance and support levels is by using technical indicators. These indicators are usually available on trading platforms provided by different exchanges or brokers and typically display support and resistance lines and zones by performing calculations on past prices.
◾ In addition to indicators, past market events are also one of the key factors in finding support and resistance lines in the market. By analyzing previous trends and recurring patterns, traders can identify support and resistance levels. However, this method is not always precise. In highly volatile and fast-changing market conditions, this method may not provide very accurate information to the trader. Nevertheless, under certain circumstances, it can still be helpful in identifying support and resistance levels.
◾ Another method that professional traders use in technical analysis to identify support and resistance levels is to look at times when the price reaches round numbers. There’s a subtle point to this approach. Experienced traders know that professional and seasoned market participants tend to trade around round price levels. This is because assets are more likely to experience significant price movements, either upwards or downwards, around such levels. Therefore, by identifying points where the price hits round numbers, traders can identify potential support and resistance levels.
◾ Beyond these three methods, some general market rules can also help identify support and resistance levels. The reversal point, where a downtrend shifts direction, often indicates a support level. If this reversal point consistently intersects with another downward trend, it can be considered a reliable support level. Similarly, to identify a resistance level, the same reversal point and its intersections with other reversal points can help pinpoint a valid resistance level. However, using this approach requires more expertise and skill.

How to Identify Breakouts
Accurately identifying breakouts in cryptocurrency and financial markets is crucial for better trade entries and exits. Three key technical tools for detecting valid breakouts are Moving Averages (MA), Bollinger Bands, and Average True Range (ATR):
1. Moving Averages (MA): Calculate the average price of an asset over a specified period. Moving averages help identify trends and potential breakouts when prices move above or below the average.
• Simple Moving Average (SMA): Averages over a specific period.
• Exponential Moving Average (EMA): Assigns more weight to recent prices, ideal for quicker breakout detection.
• Price crossing above or below key moving averages, such as 50-day or 200-day averages, often indicates a breakout.
2. Application: Traders often use the crossover of two moving averages (e.g., 50-day and 200-day) to signal bullish or bearish breakouts.
Frequently Asked Questions
What are support and resistance levels in technical analysis?
Support is a point that prevents the price of a currency, stock, or any asset from experiencing a significant decline. The resistance level, on the other hand, prevents the price of an asset from rising further.
Why do support and resistance points form?
The price of an asset is always in a struggle between the buyer and the seller. Buyers, by exerting pressure on the market, can increase the price of a stock, while sellers can decrease the price by applying pressure. Support and resistance levels form as a result of the forces from buyers or sellers on the asset’s price.
How do you identify support and resistance lines?
One of the most important ways to identify support and resistance levels is by using technical indicators. These indicators are typically available on trading platforms provided by different exchanges or brokers, and they usually display support and resistance lines and zones by performing calculations based on past prices.
How do you identify support and resistance in price action?
Traders using price action methods prepare to sell at resistance levels and to buy at support levels.