29 Jan

The Ichimoku Cloud Trade is a versatile tool that works well across forex, cryptocurrencies, and various trading styles like day trading and swing trading. Whether you’re identifying trends in volatile crypto markets or analyzing forex pairs for long-term trades, the Ichimoku Cloud Trade provides a clear edge when combined with backtesting, proper risk management, and complementary indicators like RSI, MACD, and volume. By tailoring Ichimoku strategies to specific markets and trading preferences, traders can achieve consistent results.
Start Our Crypto Screener Dashboard
1. Ichimoku Cloud in Forex Trading
The Ichimoku Cloud Trade is a powerful tool in forex trading, as it provides a multi-dimensional view of the market, helping traders identify trends, momentum, and key support/resistance zones. Unlike simple moving averages, Ichimoku gives a forward-looking perspective, allowing traders to anticipate potential price movements rather than reacting to past data.
In forex trading, trending pairs are the best candidates for Ichimoku strategies since the indicator performs poorly in sideways or choppy markets. Below, we’ll dive deeper into real-world examples and best currency pairs to use with the Ichimoku Cloud.
Read more: What is Crypto Whale Tracker? How FXonbit Empowers You to Follow Market Giants
Explore more: What is Crypto Screener? The Best Crypto Screener
Real-World Examples and Case Studies
Ichimoku works best when used on higher timeframes (4-hour, daily, and weekly) to filter out market noise. Here are two practical forex trading examples showcasing bullish and bearish setups.
1. Bullish Trend Example: EUR/USD
The EUR/USD pair is one of the most traded currency pairs in forex. It exhibits strong trends, making it a great candidate for Ichimoku trading.
Scenario:
- On the 4-hour chart, the price breaks above the Kumo (Cloud), signaling a potential uptrend.
Confirmation Signals:
- Tenkan-sen crosses above Kijun-sen, indicating a bullish shift in momentum.
- Chikou Span is above the price and Kumo, confirming that the current price is higher than 26 periods ago.
- The Future Kumo turns green, reinforcing that bullish momentum is expected to continue.
Trade Action:
- Entry: Open a long position once the price successfully closes above the Kumo.
- Stop-Loss: Place a stop-loss just below the Kumo, as a drop below could invalidate the bullish trend.
- Take Profit: Set the first target at the next major resistance level, such as a previous swing high.
- Risk Management: If the price retests the Kumo and finds support, consider adding to the position.
Explore more: Top Indicators in Crypto Screeners for Effective Trading
2. Bearish Reversal Example: GBP/JPY
The GBP/JPY pair is known for its volatility and long-lasting trends, making it ideal for Ichimoku Cloud strategies.
Scenario:
- The price falls below the Kumo, signaling a potential downtrend.
- The Kumo ahead turns red, suggesting further bearish pressure.
Confirmation Signals:
- Chikou Span moves below the price and Kumo, confirming that the price is lower than 26 periods ago.
- Tenkan-sen crosses below Kijun-sen, strengthening the bearish sentiment.
- Volume increases, supporting the downtrend.
Trade Action:
- Entry: Enter a short position once the price closes below the Kumo.
- Stop-Loss: Set a stop just above the Kumo, as a close above it may signal a trend reversal.
- Take Profit: Target a historical support level or a Fibonacci retracement zone.
- Trailing Stop: As price moves lower, trail the stop behind Kijun-sen to lock in profits.
Read more: How to Customize Crypto Screener to Match Your Trading Strategy

Explore more: How to Combine Technical Indicators for More Accurate Trade Signals
Best Currency Pairs to Use with Ichimoku Cloud
a. Trending Currency Pairs (Best for Ichimoku Cloud)
The Ichimoku Cloud works best in trending markets. The following currency pairs are known for their strong trends:
Major Pairs (High Liquidity, Strong Trends)
- EUR/USD – Most liquid pair with consistent trends.
- GBP/USD – Higher volatility but offers great trend opportunities.
- USD/JPY – Works well with Ichimoku since it’s widely traded in Japan.
Cross Pairs (Great for Medium-Term Trends)
- GBP/JPY – Highly volatile, providing strong breakout opportunities.
- EUR/AUD – Tends to trend strongly due to differences in interest rates.
Exotic Pairs (High Reward, Higher Risk)
- USD/ZAR (US Dollar vs. South African Rand)
- USD/TRY (US Dollar vs. Turkish Lira)
- These pairs can offer strong trends but come with higher spreads and lower liquidity.
- Always check liquidity and spread costs before trading these pairs.
Explore more: How to Use Volume to Confirm Market Trends and Read Market Sentiment
b. Range-Bound Pairs (Avoid for Ichimoku Trading)
Ichimoku Cloud trade does not perform well in sideways markets where the price stays within a defined range. These pairs often lack strong trends, leading to false signals.
Examples of Range-Bound Pairs to Avoid:
- EUR/CHF – Often stays in a narrow range due to European market stability.
- AUD/NZD – Moves in a tight range with frequent whipsaws.
- USD/SGD – Tends to be heavily influenced by central bank policies, making trends inconsistent.
c. Timeframes for Forex Trading with Ichimoku Cloud
Ichimoku is most effective on higher timeframes because it helps filter out market noise:
- Best Timeframes:
- 4-hour chart – Ideal for short- to medium-term trading.
- Daily chart – Best for swing traders and position traders.
- Weekly chart – Great for long-term trend analysis.
- Avoid Lower Timeframes (1-min, 5-min) for Forex:
- Too much noise and frequent false breakouts.
- Works better for crypto scalping rather than forex trading.
Explore more: What is MACD? Full Guidance
Pro Tips for Using Ichimoku Cloud in Forex Trading
- Wait for Clear Signals:
- The best Ichimoku trade setups happen when multiple components align (Kumo breakout, crossovers, Chikou Span confirmation).
- Avoid trading when the price is inside the Cloud, as it indicates indecision.
- Check Higher Timeframes for Confirmation:
- Before entering a trade, confirm the trend on a higher timeframe.
- Example: If trading on the 4-hour chart, check the daily chart to ensure alignment.
- Use Ichimoku with Fundamental Analysis:
- Forex markets are heavily influenced by economic events like interest rate decisions, inflation data, and employment reports.
- If a currency pair is fundamentally strong but shows a bearish Ichimoku signal, reconsider the trade.
- Beware of False Breakouts:
- If price briefly moves above/below the Cloud but quickly reverses, it may be a false breakout.
- Use additional confirmation like RSI or MACD to validate the move.
- Use the Cloud for Trailing Stops:
- In strong trends, price often pulls back to the Kumo before continuing.
- Instead of setting a static stop-loss, use the Kumo as a trailing stop to maximize gains.
Explore more: Liquidity; The Backbone of Financial Markets
Read more: What is Crypto Whale Tracker? How FXonbit Empowers You to Follow Market Giants
2. Ichimoku Cloud in Cryptocurrency Trading
Cryptocurrencies are known for their high volatility, rapid price swings, and extended trends, making the Ichimoku Cloud Trade a valuable tool for identifying trends, breakouts, and reversals. To effectively use Ichimoku Cloud in cryptocurrency trading, traders need to adapt the indicator to crypto’s unique behavior and apply specific strategies tailored for high-volatility assets like BTC, ETH, and altcoins.
Read it: How to Identify Breakouts by Crypto Screener
Adapting the Cloud to Crypto’s Unique Price Behavior
a. Shorter Settings
- Why Adjust Settings?
- Cryptocurrencies are significantly more volatile than forex or stock markets, with price movements occurring at a much faster pace. The default Ichimoku settings (9-26-52) were designed for slower-moving markets and may lag behind in crypto.
- Recommended Settings:
- Change the settings to 6-24-48 for quicker reactions to price movements.
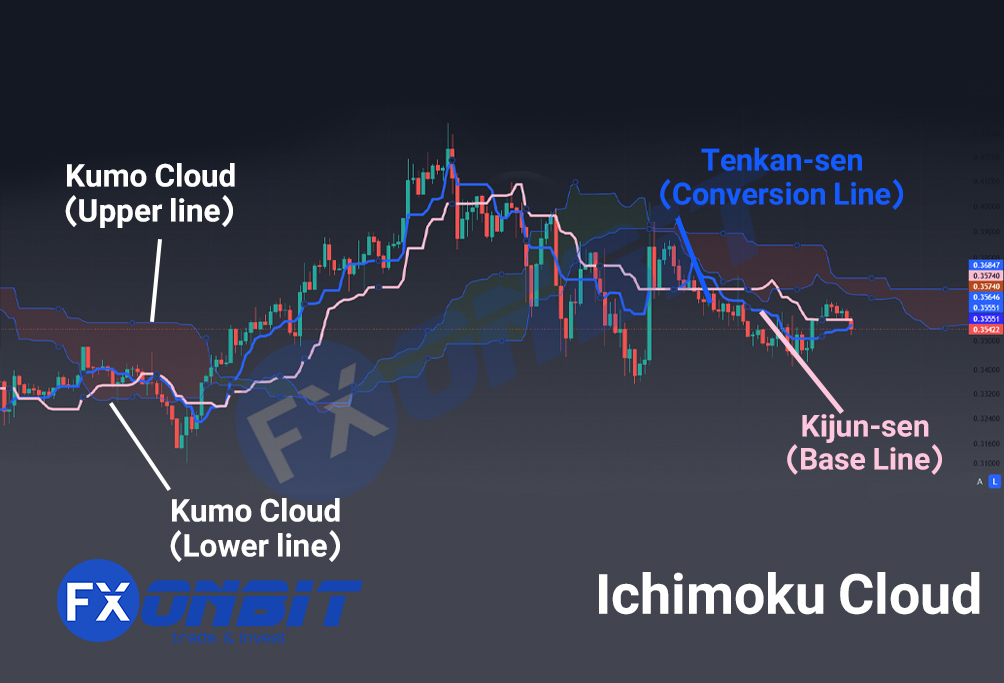
- Tenkan-sen (Conversion Line): 6-period average.
- Kijun-sen (Base Line): 24-period average.
- Kumo: Calculated over 48 periods and projected 24 periods ahead.
- Shorter settings capture fast-moving trends while still filtering out minor fluctuations.
- Change the settings to 6-24-48 for quicker reactions to price movements.
Explore more: Analyzing Volume Patterns for Breakout & Reversal Signals
b. Focus on Volume
- Why Volume Matters in Crypto:
- High volume is a critical confirmation tool in crypto markets. Breakouts above or below the Kumo with strong volume indicate institutional or whale activity, strengthening the reliability of the signal.
- How to Use Volume:
- During a Kumo breakout, ensure that volume increases significantly. A breakout without volume may lead to false signals.
- Combine Ichimoku with volume-based indicators like On-Balance Volume (OBV) or Volume Profile for additional insights.
c. Use the Kumo for Pullbacks
- Why Pullbacks Matter:
- The Kumo (Cloud) acts as a dynamic support or resistance zone, making it an excellent area to reenter trades during pullbacks in strong trends.
- How to Trade Pullbacks:
- Bullish Trend: When the price pulls back to the upper boundary of the Kumo (Senkou Span A), watch for a bounce to reenter long positions.
- Bearish Trend: In a downtrend, wait for the price to retrace to the lower boundary of the Kumo (Senkou Span B) before shorting.
- Example:
- In a bullish BTC/USDT market, if the price pulls back to the Kumo and finds support, this presents a strong reentry point.
Strategies for BTC, ETH, and Altcoins
a. BTC/USDT (Breakout Strategy)
- Scenario:
- On the daily chart, Bitcoin (BTC) breaks above the Kumo with the future Cloud turning green.
- Trade Action:
- Entry: Open a long position once the price decisively closes above the Kumo.
- Confirmation:
- Look for a bullish crossover of Tenkan-sen and Kijun-sen.
- Ensure the Chikou Span is above the price and Kumo.
- Stop-Loss: Place the stop-loss just below the lower boundary of the Kumo to protect against false breakouts.
- Take Profit: Target the next major resistance level, such as a recent swing high or Fibonacci extension level.
- Pro Tip:
- If volume spikes during the breakout, this adds confidence to the trade.
b. ETH/USDT (Swing Trading Strategy)
- Scenario:
- On the 4-hour chart, Ethereum (ETH) experiences a pullback into the Kumo after a strong uptrend.
- Trade Action:
- Entry: Buy near the upper boundary of the Kumo (Senkou Span A).
- Confirmation:
- Combine with RSI in oversold territory (below 30) for additional confirmation.
- Ensure Tenkan-sen remains above Kijun-sen.
- Stop-Loss: Place a stop-loss just below the Kumo to manage risk.
- Take Profit: Target a price level just below the previous swing high or a psychological resistance zone (e.g., $2000 for ETH).
- Pro Tip:
- Use Fibonacci retracements in conjunction with the Kumo to pinpoint key pullback levels (e.g., 50% or 61.8%).
c. Altcoins (Trend Continuation Strategy)
- Why Use Ichimoku for Altcoins?
- Altcoins with strong trends (e.g., SOL/USDT, DOT/USDT) often show clear breakouts and pullbacks, making them suitable for Ichimoku Cloud Trade strategies.
- How to Apply:
- Focus on breakouts above or below the Kumo, but only trade altcoins with sufficient liquidity to avoid slippage.
- Ensure the Chikou Span aligns with the price and the Kumo.
- Example:
- Bullish Continuation: If an altcoin like SOL/USDT breaks above the Kumo on the daily chart, enter a long position. Place a stop-loss just below the Kumo.
- Bearish Continuation: If an altcoin like XRP/USDT breaks below the Kumo, open a short position. Place the stop-loss above the Kumo.
- Pro Tip:
- Avoid low-liquidity altcoins as they may produce false breakouts and exaggerated moves.
Explore more: Symmetrical Triangle Pattern: A Powerful Price Action Signal
Practical Tips for Using Ichimoku in Crypto
- Timeframes:
- For short-term trades, use 1-hour or 4-hour charts.
- For swing trades, rely on the daily chart for clearer trends.
- Watch for Volatility:
- Cryptos are highly volatile. Tighten stop-losses during periods of increased market activity (e.g., after major news or economic announcements).
- Adjust to the Market’s Behavior:
- In high-volume crypto markets, rely more on Kumo breakouts.
- In quieter markets, focus on pullbacks to the Kumo for safer entries.
- Combine with Other Indicators:
- Pair Ichimoku with MACD or RSI to confirm momentum and trend strength.
- Use Bollinger Bands to gauge volatility and identify overextended conditions.
- Backtesting:
- Test Ichimoku strategies using historical data to identify which settings and timeframes work best for specific cryptocurrencies.
Read more: Best Crypto Screener for Trading

3. Backtesting Ichimoku Cloud Strategies
Backtesting is an essential step for validating the effectiveness of Ichimoku Cloud trade strategies. It allows traders to assess their strategy using historical data, identify potential flaws, and gain confidence in their approach before trading with real capital. Here’s a detailed guide on how to effectively backtest Ichimoku Cloud strategies.
How to Backtest Ichimoku Strategies
a. Choose a Platform
Selecting a platform with robust backtesting tools is crucial. Popular options include:
- TradingView:
- User-friendly interface with customizable Ichimoku settings.
- Allows easy manual backtesting and provides historical data for most markets.
- MetaTrader 4/5 (MT4/MT5):
- Offers both manual and automated backtesting capabilities.
- Great for forex traders.
- NinjaTrader:
- Ideal for automated backtesting and detailed statistical analysis.
Why the Platform Matters:
A good platform should offer:
- Access to historical data across multiple assets and timeframes.
- Customizable settings for Ichimoku components (e.g., Tenkan-sen, Kijun-sen).
- Easy-to-read charts and performance metrics.
Read it: 40 Powerful Candlestick Patterns in Forex and Crypto Trading
b. Select a Market and Timeframe
Choosing the right market and timeframe is critical for meaningful backtesting.
- Market:
- Focus on trending markets, as Ichimoku performs best in these conditions.
- Examples:
- Forex: EUR/USD, GBP/USD, USD/JPY.
- Crypto: BTC/USDT, ETH/USDT.
- Timeframe:
- Test on multiple timeframes to determine which suits your strategy best:
- 4-Hour Chart: Ideal for short- to medium-term trading.
- Daily Chart: Suitable for swing and position trading.
- Weekly Chart: For long-term traders.
- Test on multiple timeframes to determine which suits your strategy best:
Why Testing on Multiple Timeframes Matters:
- Different strategies may work better on specific timeframes.
- For example:
- Scalpers might find success with shorter timeframes like 1-hour or 15-minute charts.
- Swing traders might rely on daily charts for clearer trend signals.
c. Define Entry and Exit Rules
Clear and consistent rules are vital for accurate backtesting. Below are example rules for a bullish Ichimoku strategy:
- Entry Rules (Bullish):
- Price closes above the Kumo, signaling a potential uptrend.
- Chikou Span (Lagging Line) is above the price and the Kumo, confirming bullish momentum.
- Tenkan-sen crosses above Kijun-sen, indicating bullish momentum.
- Exit Rules:
- Exit when the price reenters the Kumo, indicating weakening momentum.
- Alternatively, exit if Tenkan-sen crosses below Kijun-sen, signaling a potential trend reversal.
- Bearish Strategy:
- Reverse the rules above:
- Entry: Price closes below the Kumo, Chikou Span is below the price/Kumo, and Tenkan-sen crosses below Kijun-sen.
- Exit: When price reenters the Kumo or Tenkan-sen crosses above Kijun-sen.
- Reverse the rules above:
Pro Tip:
- Use stop-loss orders to manage risk. Place stops:
- Bullish Trades: Below the lower boundary of the Kumo.
- Bearish Trades: Above the upper boundary of the Kumo.
d. Analyze Results
Once you’ve defined and applied your strategy, review its performance based on key metrics:
- Win Rate:
- The percentage of trades that were profitable.
- Example: If 70 out of 100 trades were successful, the win rate is 70%.
- Risk/Reward Ratio:
- The balance between potential profit and risk per trade.
- Aim for a ratio of at least 1:2, meaning your potential reward is twice the size of your risk.
- Drawdown:
- The maximum loss experienced during the backtest.
- Example: If your account equity dropped by 20% during the test, the drawdown is 20%.
- Lower drawdowns indicate a more stable strategy.
- Total Return:
- The overall profit or loss generated by the strategy during the backtest period.
- Trade Frequency:
- How often the strategy generates signals. High-frequency strategies may incur more transaction costs.
Read more: How to Analyze Altcoins Effectively Using a Crypto Screener
Example Backtest: Bullish Strategy on BTC/USDT
Setup:
- Platform: TradingView
- Timeframe: Daily Chart
- Ichimoku Settings: Default (9-26-52)
- Rules:
- Entry: Price closes above the Kumo, Chikou Span is above the price/Kumo, and Tenkan-sen crosses above Kijun-sen.
- Exit: Price reenters the Kumo or Tenkan-sen crosses below Kijun-sen.
Results:
- Win Rate: 65%
- Risk/Reward Ratio: 1:3 (average risk $500, average reward $1,500).
- Drawdown: 18%
- Total Return: 45% over six months.
- Trade Frequency: 15 trades over six months.
Tips for Effective Backtesting
- Stay Consistent:
- Use the same rules and parameters for the entire backtest period to avoid bias.
- Test Across Different Markets:
- Backtest the strategy on multiple pairs/assets to ensure it works consistently.
- Evaluate Different Settings:
- Experiment with settings like 6-24-48 (shorter settings for high-volatility markets like crypto) to find the optimal configuration for your strategy.
- Account for Fees and Slippage:
- Include transaction costs and potential slippage in your analysis to reflect real-world trading conditions.
- Forward-Test Your Strategy:
- After backtesting, apply the strategy in a demo account to test its performance in live market conditions before using real capital.
Explore more: Filtering High-Volume Cryptos: Guide to Finding Liquidity with Screeners
4. Ichimoku Cloud vs. Moving Averages
Both Ichimoku Cloud Trade and Moving Averages (MAs) are widely used technical analysis tools for identifying trends in the market. However, Ichimoku Cloud offers a more comprehensive approach compared to the simplicity of MAs. Here’s a detailed comparison, highlighting why many traders might prefer Ichimoku over traditional MAs.
Why Traders Might Prefer Ichimoku Over Traditional MAs
a. Multi-Faceted Analysis
- Ichimoku Cloud:
- The Ichimoku system provides a complete market picture with multiple components working together to offer:
- Trend Direction: The position of the price relative to the Kumo indicates bullish or bearish trends.
- Momentum: Tenkan-sen and Kijun-sen crossovers measure momentum shifts.
- Support and Resistance: The Kumo acts as dynamic support/resistance levels.
- Future Projections: The Cloud (Kumo) is plotted 26 periods ahead, offering a forward-looking perspective.
- It eliminates the need for multiple separate indicators (like RSI, support/resistance lines, and MAs), as it combines all these functionalities in one tool.
- The Ichimoku system provides a complete market picture with multiple components working together to offer:
- Moving Averages:
- MAs are single-dimensional, providing only trend direction based on the smoothing of price data.
- While they’re effective at identifying the overall trend, they don’t give insights into momentum or future market projections.
b. Dynamic Support and Resistance
- Ichimoku Cloud:
- The Kumo (Cloud) adapts to price volatility, acting as a dynamic support or resistance zone. Its thickness reflects market strength:
- Thick Cloud: Indicates strong support/resistance and high volatility.
- Thin Cloud: Suggests weaker support/resistance and potential for breakouts.
- This adaptability makes the Kumo highly reliable in trending markets and pullbacks, where traditional support/resistance lines may fail.
- The Kumo (Cloud) adapts to price volatility, acting as a dynamic support or resistance zone. Its thickness reflects market strength:
- Moving Averages:
- MAs do not inherently provide support or resistance zones. They can act as basic dynamic support/resistance levels when the price touches or crosses them, but they lack the adaptability of Ichimoku’s Kumo.
- Multiple MAs (e.g., 50-day and 200-day) can be used together to approximate support/resistance, but they don’t account for market volatility like the Kumo does.
Read more: Price Action Trading: The Art of Trading Without Indicators
c. Clearer Entry/Exit Signals
- Ichimoku Cloud:
- The interplay of Ichimoku’s components offers precise entry and exit signals:
- Tenkan-sen and Kijun-sen Crossovers: Bullish/bearish crossovers signal potential entries or exits.
- Kumo Breakouts: A price breakout above or below the Kumo signals potential trend continuation or reversal.
- Chikou Span (Lagging Line): Confirms the strength of a trend by comparing current price action to historical levels.
- Pullbacks to the Kumo: Provide reliable reentry points in trending markets.
- These dynamic signals allow traders to align their positions with the current market momentum and future projections.
- The interplay of Ichimoku’s components offers precise entry and exit signals:
- Moving Averages:
- MA crossovers (e.g., 50-day and 200-day) provide basic entry/exit signals:
- Golden Cross: When a short-term MA crosses above a long-term MA, it signals a buy.
- Death Cross: When a short-term MA crosses below a long-term MA, it signals a sell.
- However, these signals often lag behind price action, as MAs rely entirely on historical price data.
- MA crossovers (e.g., 50-day and 200-day) provide basic entry/exit signals:
Read more: FXonbit CandleStick Pattern Finder Service: Your Gateway to Smarter Forex and Crypto Trading
Examples of Ichimoku vs. Moving Averages
Example 1: Bullish Trend Continuation
- Ichimoku Cloud:
- Price breaks above the Kumo, signaling a bullish trend.
- The future Kumo turns green, confirming continued upward momentum.
- Entry Signal: Tenkan-sen crosses above Kijun-sen, supported by the Chikou Span above the price.
- Exit Signal: When price reenters the Kumo or Tenkan-sen crosses below Kijun-sen.
- Moving Averages:
- A simple bullish signal might occur when the 50-day MA crosses above the 200-day MA (Golden Cross).
- However, MAs won’t provide insights into support/resistance zones or future momentum, leaving traders without context for pullbacks or projections.
Example 2: Bearish Reversal
- Ichimoku Cloud:
- Price breaks below the Kumo, and the Cloud turns red, signaling a bearish trend.
- Entry Signal: Tenkan-sen crosses below Kijun-sen, with the Chikou Span below the price.
- Exit Signal: When the price moves back above the Kumo or Tenkan-sen crosses back above Kijun-sen.
- Moving Averages:
- A bearish crossover (Death Cross) between the 50-day and 200-day MA signals a trend reversal.
- However, MAs won’t provide dynamic support/resistance levels to guide entry/exit points during pullbacks.
When to Use Ichimoku vs. Moving Averages
| Criteria | Ichimoku Cloud | Moving Averages |
|---|---|---|
| Trend Identification | Comprehensive (includes momentum & volatility) | Basic, based on price smoothing. |
| Support/Resistance | Dynamic (Kumo adapts to volatility). | Basic, acts as static dynamic levels. |
| Entry/Exit Precision | Multiple signals (crossovers, Kumo breakouts). | Limited to MA crossovers. |
| Market Volatility | Handles volatility better (via Kumo thickness). | Struggles in volatile markets. |
| Ease of Use | Requires practice to master. | Simpler to understand for beginners. |
| Best for | Trending and volatile markets. | Long-term trend analysis in stable markets. |
5. Real-World Trading Examples Using Ichimoku Cloud Trade
Day Trading (Scalping) with Ichimoku
Day trading or scalping with Ichimoku involves using short timeframes, such as the 5-minute chart, to capitalize on quick price movements. The focus is on fast entries and exits, relying on Kumo breakouts and Chikou Span confirmation.
- Example Scenario:
- On a 5-minute BTC/USDT chart, the price breaks above the Kumo.
- The Chikou Span is above the price and the Kumo, confirming bullish momentum.
- The Kumo ahead turns green, signaling continuation of the uptrend.
- Trade Execution:
- Entry: Enter a long position as soon as the breakout candle closes above the Kumo.
- Stop-Loss: Place the stop-loss just below the lower boundary of the Kumo to minimize risk.
- Exit: Close the trade as the price approaches a historical resistance level or when momentum slows, as indicated by a reversal in the Tenkan-sen or Chikou Span.
- Pro Tip for Scalping:
- Watch for high volume during the breakout to confirm the validity of the move.
- Tight stop-losses are essential, as short timeframes are prone to sudden reversals.
Swing Trading with Ichimoku
Swing trading uses longer timeframes, such as the 4-hour or daily chart, to capture medium-term price movements. The goal is to enter during pullbacks to the Kumo and hold positions for larger trends.
- Example Scenario:
- On the 4-hour EUR/USD chart, the pair pulls back to the Kumo after a strong bullish trend.
- The price finds support at the upper boundary of the Kumo (Senkou Span A).
- The Tenkan-sen remains above the Kijun-sen, indicating that bullish momentum is still intact.
- Trade Execution:
- Entry: Enter a buy position as the price bounces off the Kumo’s upper boundary.
- Stop-Loss: Set the stop-loss just below the lower boundary of the Kumo to allow for slight volatility.
- Exit: Close the trade when the price approaches a major resistance level, such as a previous swing high or psychological level (e.g., 1.20 for EUR/USD).
- Pro Tip for Swing Trading:
- Combine the Ichimoku Cloud with RSI or MACD to confirm that the pullback to the Kumo is temporary and not the start of a reversal.
- Use Fibonacci retracements to align the Kumo’s boundaries with key levels (e.g., 61.8%).
Summary of Execution Differences
- Day Trading (Scalping):
- Timeframe: 5-minute chart.
- Goal: Quick profits during breakouts.
- Stop-Loss: Tight, just below Kumo.
- Exit: As price approaches resistance or momentum fades.
- Swing Trading:
- Timeframe: 4-hour or daily chart.
- Goal: Capture medium-term trends during pullbacks.
- Stop-Loss: Wider, below the Kumo boundary.
- Exit: At significant resistance or when trend weakens.
By adjusting Ichimoku strategies to suit your trading style, you can effectively capitalize on short-term scalping opportunities or medium-term swing trades.
6. Day Trading with Ichimoku Cloud Trade
Scalping Strategies for Intraday Traders:
- Use the Tenkan-sen and Kijun-sen crossovers on shorter timeframes (e.g., 5-minute, 15-minute charts).
- Focus on Kumo breakouts with high volume for quick trades.
- Set tight stop-loss levels just below the Kumo for minimal risk.
7. Swing Trading with Ichimoku Cloud Trade
Strategies for Longer-Term Trades:
- Use higher timeframes like the 4-hour, daily, or weekly charts.
- Look for Cloud reversals (e.g., red Cloud turning green) for potential trend changes.
- Set stop-loss orders at key Kumo levels and let trades run until the trend shows signs of exhaustion.
Hi, I’m Asena, a Senior Marketing Specialist with over 8 years of experience and a deep passion for trading knowledge. I have a genuine fascination with the world of Crypto and Forex markets. Over the past 6 years, I’ve dedicated myself to writing about technical analysis, fundamental analysis, and the intricate dynamics of these markets. My mission is to provide the most complete and comprehensive data to empower my audience with actionable insights. I truly love what I do and constantly strive to deliver the best possible results for my readers and users.


Asena Taremi