23 Jul

Support and resistance levels are the backbone of technical analysis, guiding traders through the market’s twists and turns. These pivotal price points help traders anticipate market movements, identify entry and exit opportunities, and manage risk effectively. Whether you’re deciphering static lines or dynamic moving averages, mastering support and resistance can transform your trading strategy. Dive into this comprehensive guide to unlock the secrets of market behavior and enhance your trading acumen.
Read More: Trading Chart Patterns: What Are Chart Patterns? + PDF
Support and Resistance
Support and resistance levels are fundamental concepts in technical analysis, serving as key indicators of price behavior in financial markets. Understanding these concepts allows traders to make informed decisions, identify potential entry and exit points, and manage risk more effectively.
Read the Detail: What is Support and Resistance Lines in Trading
Role of Support and Resistance
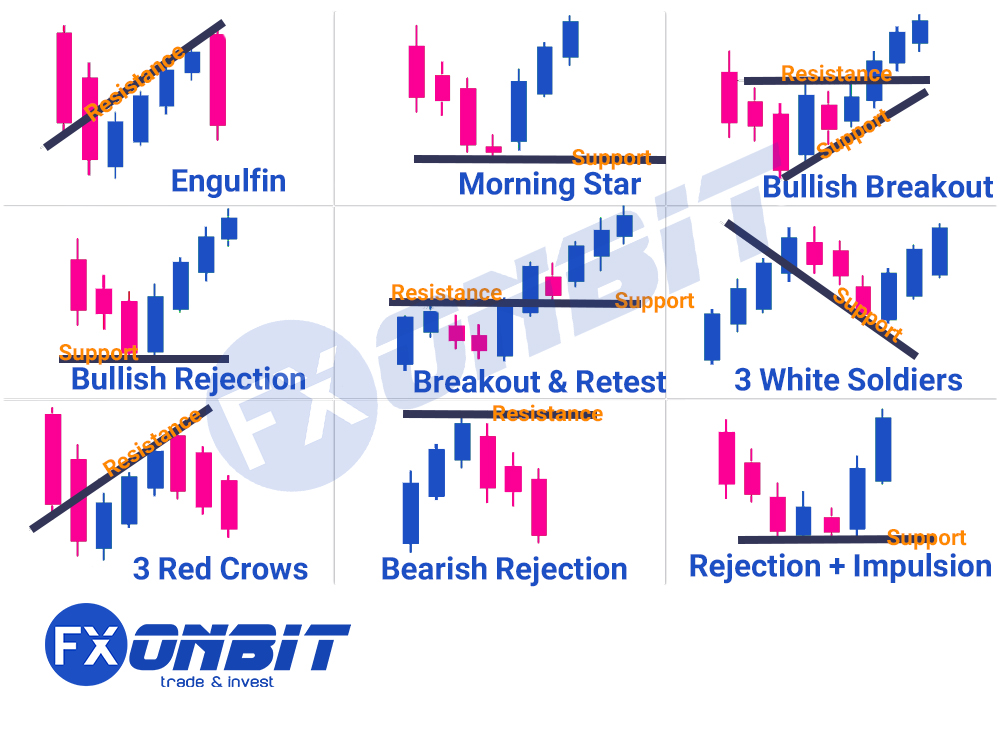
Support and resistance levels are psychological and technical barriers that the price of an asset tends to respect. They are crucial in understanding market dynamics and trader behavior.
Support
Support is a price level where a downtrend can be expected to pause due to a concentration of demand. As the price of an asset falls towards a support level, buyers become more likely to purchase it, creating a “floor” that prevents the price from falling further.
Characteristics:
- Demand Zone: Support levels are typically seen as areas where buyers are likely to enter the market.
- Psychological Impact: Market participants often perceive support levels as good buying opportunities.
- Multiple Tests: The more times a support level is tested without being broken, the stronger it becomes.
Read more: Exponential Moving Average (EMA): A Comprehensive Guide for Traders

Read more: Trading the Head and Shoulders Pattern: A Complete Guide
Resistance
Resistance is a price level where an uptrend can be expected to pause due to a concentration of supply. As the price of an asset rises towards a resistance level, sellers become more likely to sell it, creating a “ceiling” that prevents the price from rising further.
Characteristics:
- Supply Zone: Resistance levels are typically seen as areas where sellers are likely to enter the market.
- Psychological Impact: Market participants often perceive resistance levels as good selling opportunities.
- Multiple Tests: The more times a resistance level is tested without being broken, the stronger it becomes.
Read More: Resistance Breakout (Breakout) in Technical Analysis

Determining the Validity of Support or Resistance Levels
To draw a support line, we must recognize that there is always a support range rather than a precise support point. This means that the specific point of support can be influenced by calculation errors, potentially leading to misinterpretation by the analyst. Therefore, we should consider a range as the support level. To determine the validity of a support or resistance level, two general methods must be examined:
-
The Slope of the Line:
The flatter the line, the stronger it is. In other words, if the line you draw for support or resistance is horizontal, it is more reliable. -
Reactions to the Line or Range:
To evaluate a line or range as support or resistance, the number and type of reactions the price has to that range must be examined. The more often the price touches these lines and the more accurate the reactions to them, the more valid and reliable the support and resistance lines become for trading decisions.
Read More: What is a Breakdown in Technical Analysis?
Manually Drawing Support & Resistance Lines in TradingView
In addition to using indicators that automatically draw support and resistance lines, you can also manually draw these areas using line-drawing tools. As previously mentioned, support and resistance areas can be either static or dynamic. The tools for each type are explained below.
One of the simplest methods for drawing dynamic Support and Resistance lines in TradingView is to use the trendline tool. This tool can be accessed from the line-drawing tools section, where the option named “Trend Line” is available. In the next section, we will explain how to use this tool.
Chart Pattern: Descending Channel Pattern: A Comprehensive Guide

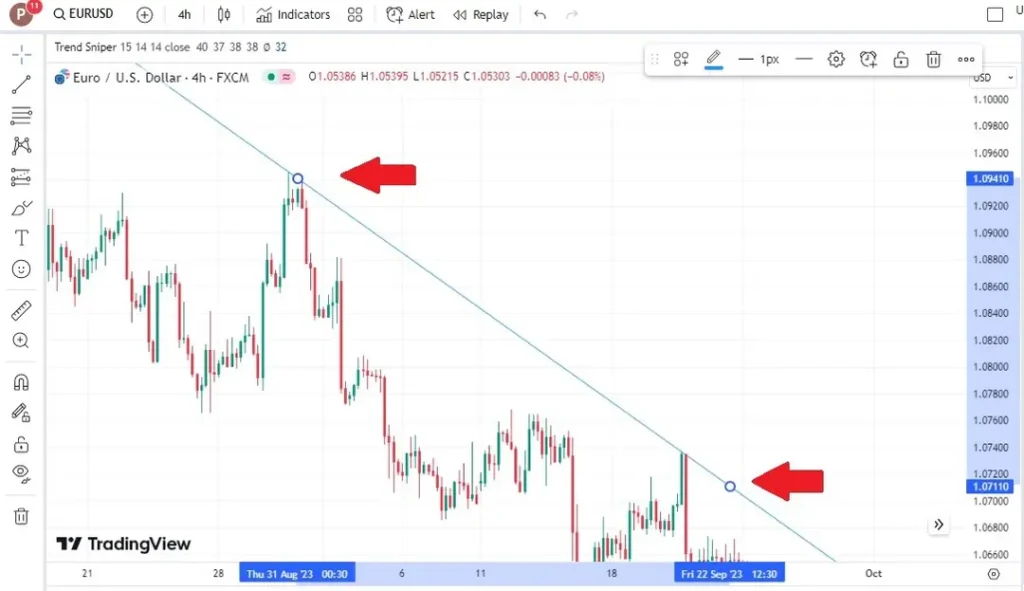
How to Draw a Dynamic Resistance Line
To draw this resistance line, first select the Trend Line tool, then click on one of your desired price highs. Hold down the mouse button and drag it to the second price high, releasing the mouse button there. By doing this, a dynamic resistance line will be drawn for you.
As long as this resistance line remains valid, it is expected that the price will fall each time it touches the line. However, as explained earlier, the possibility of a trend breakout always exists.
Read more: Bearish and Bullish Megaphone Patterns
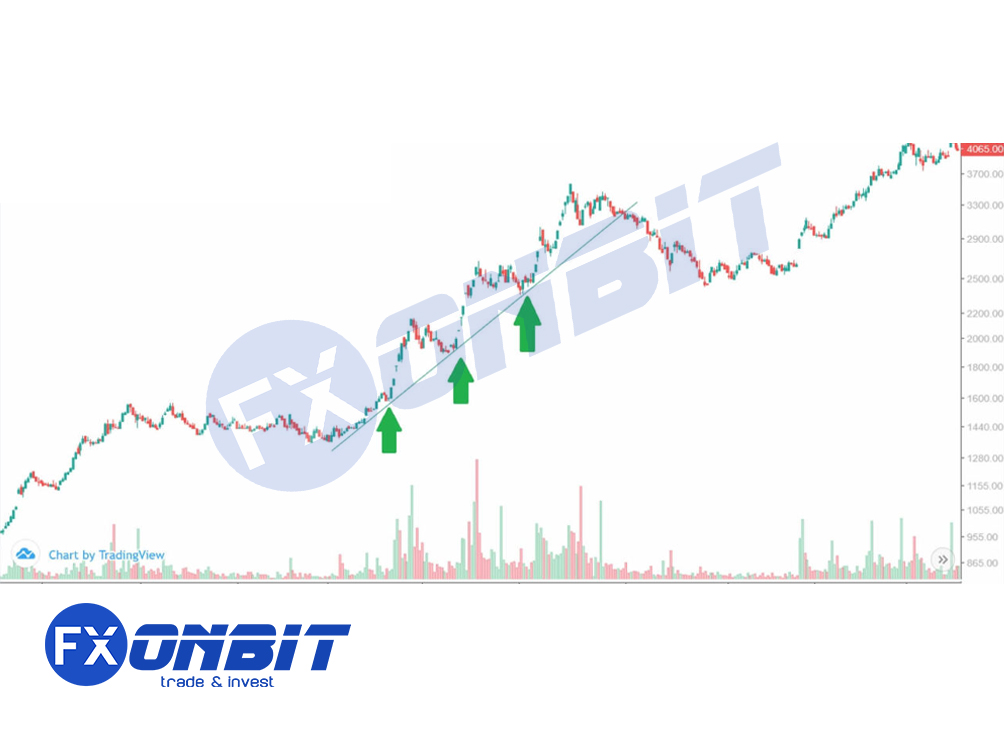
How to Draw a Dynamic Support Line
A support line is drawn similarly to a resistance line, with the difference being that you connect the price lows instead of the highs. After selecting the tool, click on your desired price low, drag the mouse to another price low, and release.
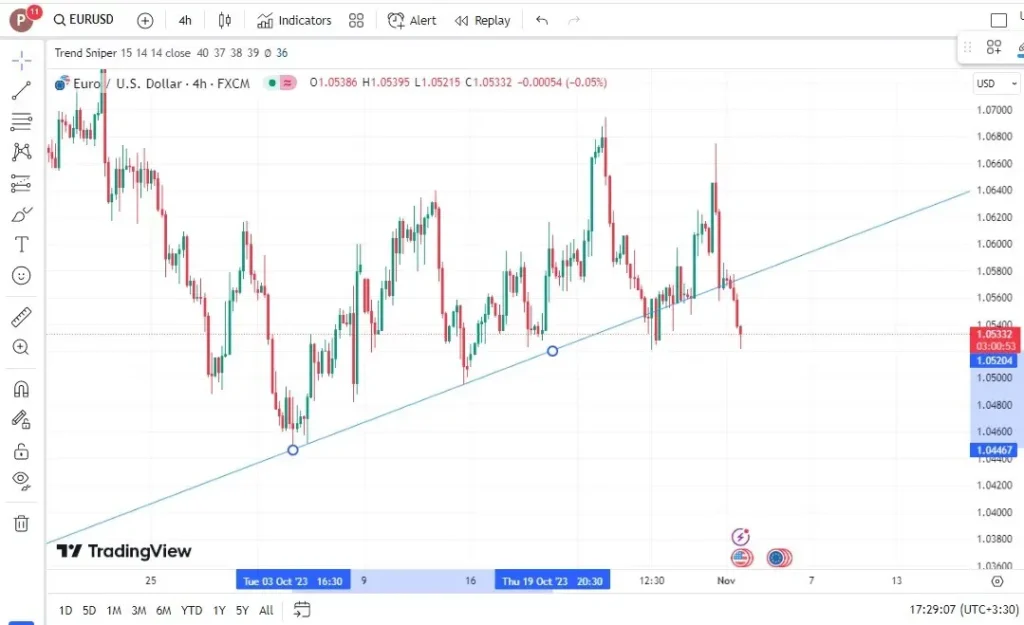
As shown in the image, this dynamic support line may lose its strength after multiple price touches. When the support line is broken, its fate will likely be one of the following:
- The support line may turn into a resistance line, where each time the price reaches it, a decline is observed.
- The support line may lose its validity entirely and no longer play a significant role.
Read more: Exponential Moving Average (EMA): A Comprehensive Guide for Traders
Identifying Support Levels
To draw a support line, follow these steps:
- Identify Significant Lows: Look for price points where the asset has made significant lows.
- Connect the Lows: Draw a horizontal line connecting these lows. The line should touch as many lows as possible without cutting through the price action.
- Extend the Line: Extend the line into the future to act as a potential support level.
Example:
- If a stock price has bounced back up every time it reached $50, then $50 is a support level.
Read more: Trading the Inverse Head and Shoulders Pattern: A Comprehensive Guide for Traders
Identifying Resistance Levels
To draw a resistance line, follow these steps:
- Identify Significant Highs: Look for price points where the asset has made significant highs.
- Connect the Highs: Draw a horizontal line connecting these highs. The line should touch as many highs as possible without cutting through the price action.
- Extend the Line: Extend the line into the future to act as a potential resistance level.
Example:
- If a stock price has dropped every time it reached $100, then $100 is a resistance level.
Read more: Price Action Trading: The Art of Trading Without Indicators
Combining Support and Resistance
Combining support and resistance analysis with other technical indicators can provide a more comprehensive view of the market.
Tips:
- Use Multiple Time Frames: Analyzing support and resistance levels on different time frames can provide a broader perspective.
- Look for Confluence: When support or resistance levels coincide with other technical indicators (like moving averages or Fibonacci levels), they become more significant.
- Monitor Volume: High trading volume near support or resistance levels can indicate stronger potential reversals or breakouts.
Dynamic Support and Resistance (Moving Averages)
Unlike static support and resistance levels, which remain fixed, dynamic support and resistance levels change over time. Moving averages are a popular tool for identifying dynamic support and resistance.
Moving Averages
A moving average (MA) smooths out price data by creating a constantly updated average price. The most common types of moving averages are the Simple Moving Average (SMA) and the Exponential Moving Average (EMA).
Types of Moving Averages:
- Simple Moving Average (SMA): Calculated by averaging a set number of past closing prices. For example, a 50-day SMA adds up the closing prices of the last 50 days and divides by 50.
- Exponential Moving Average (EMA): Gives more weight to recent prices, making it more responsive to new information.
Using Moving Averages as Dynamic Support and Resistance
Moving averages can act as dynamic support or resistance levels, where prices often react when they approach these lines.
How to Use:
- Identify Trend Direction: Moving averages can help determine the overall trend direction. Prices above a moving average suggest an uptrend, while prices below suggest a downtrend.
- Support in Uptrend: In an uptrend, moving averages (like the 50-day or 200-day MA) can act as dynamic support levels where prices may bounce back up.
- Resistance in Downtrend: In a downtrend, moving averages can act as dynamic resistance levels where prices may bounce back down.
Example:
- In a strong uptrend, the 50-day MA might act as a support level, with the price bouncing back each time it approaches the MA line.
Combining Moving Averages with Support and Resistance
Combining moving averages with traditional support and resistance levels can enhance trading strategies.
Tips:
- Multiple Moving Averages: Use multiple moving averages (e.g., 50-day and 200-day) to identify both short-term and long-term trends.
- Crossovers: When a short-term MA crosses above a long-term MA (golden cross), it can signal a bullish trend. Conversely, when a short-term MA crosses below a long-term MA (death cross), it can signal a bearish trend.
- Confluence with Static Levels: When a moving average coincides with a horizontal support or resistance level, it strengthens the significance of that level.

Practical Applications of Support and Resistance
Support and resistance levels can be used in various trading strategies and risk management practices.
Trading Strategies
Bounce Strategy:
- Buy at Support: Enter a long position near a support level with the expectation that the price will bounce back up.
- Sell at Resistance: Enter a short position near a resistance level with the expectation that the price will drop back down.
Breakout Strategy:
- Buy on Breakout: Enter a long position when the price breaks above a resistance level, indicating potential for further upward movement.
- Sell on Breakdown: Enter a short position when the price breaks below a support level, indicating potential for further downward movement.
Using Moving Averages:
- Trend Following: Use moving averages to identify and follow the trend. For example, enter long positions when the price is above the 50-day MA and short positions when the price is below the 50-day MA.
- Crossover Signals: Use moving average crossovers as entry and exit signals. For example, enter a long position when the 50-day MA crosses above the 200-day MA (golden cross) and exit or enter a short position when the 50-day MA crosses below the 200-day MA (death cross).
Risk Management
Stop-loss Orders:
- Below Support: Place stop-loss orders just below support levels to limit potential losses in case the price breaks down.
- Above Resistance: Place stop-loss orders just above resistance levels to protect against potential losses in case the price breaks out against your position.
Position Sizing:
- Support and Resistance Zones: Adjust position sizes based on the strength and significance of support and resistance levels. Larger positions can be taken when trading near strong, well-established levels.
- Moving Average Proximity: Adjust position sizes based on the proximity of the price to moving averages, with smaller positions taken when prices are near dynamic support or resistance levels.
Conclusion
Support and resistance are fundamental concepts in technical analysis that provide critical insights into market behavior. By understanding the role of support and resistance, mastering the art of drawing these lines, and utilizing dynamic support and resistance through moving averages, traders can develop more effective trading strategies and better manage risk. This comprehensive guide equips you with the knowledge needed to analyze support and resistance levels, empowering you to make more informed and strategic trading decisions.
With this detailed exploration of support and resistance, you now have a solid foundation to understand and utilize these concepts in your trading strategies. Whether you are identifying static levels or leveraging dynamic levels through moving averages, the principles outlined in this guide will help you navigate the financial markets with confidence and precision.