21 Jan
Cryptocurrency trading can be complex and fast-paced, requiring the right tools and insights to make informed decisions. Crypto screeners are invaluable for traders as they filter and analyze vast market data to pinpoint opportunities. However, to maximize their potential, it’s crucial to understand the essential indicators they provide and how to use them effectively.
Start Our Dashboard Forex & Crypto
In this guide, we will explore the top indicators you should focus on when using crypto screeners, how they work, and how they can enhance your trading strategies.
Explore more: What is Crypto Screener? The Best Crypto Screener
1. Relative Strength Index (RSI)
The Relative Strength Index (RSI) is a momentum oscillator that measures the speed and change of price movements. It ranges from 0 to 100 and is commonly used to identify overbought or oversold conditions in the market.
How It Works:
- RSI Above 70: Indicates that a cryptocurrency might be overbought, signaling a potential price correction or reversal.
- RSI Below 30: Suggests an oversold condition, indicating a possible price rebound or upward movement.
Where to Open or Close Positions:
- Overbought (RSI > 70):
- Consider opening a short position when RSI exceeds 70.
- Close the position as RSI drops back below 70.
- Oversold (RSI < 30):
- Consider opening a long position when RSI falls below 30.
- Close the position as RSI rises above 30.
Read more: Ichimoku Cloud Trading Strategies for Beginners
Use Case in a Crypto Screeners:
A crypto screener with RSI functionality can help traders filter and identify cryptocurrencies nearing these key RSI thresholds. This allows traders to quickly locate assets with potential trading opportunities.
Read more: Maximize Your Crypto Profits with a Crypto Screener
Screening Data to Include:
- RSI Value: Display the current RSI for each cryptocurrency.
- Trending Direction: Indicate whether the RSI is increasing or decreasing.
- Timeframe: Allow users to select different timeframes (e.g., 1h, 4h, 1d) to analyze RSI trends.
- Filter Options:
- Cryptocurrencies with RSI > 70 (Overbought).
- Cryptocurrencies with RSI < 30 (Oversold).
- Custom Alerts: Enable users to set notifications for specific RSI levels (e.g., alert when RSI crosses above 70 or below 30).
- Historical RSI Chart: Include a visual representation of the RSI trend over time for selected cryptocurrencies.
Read more: How to Customize Crypto Screener to Match Your Trading Strategy
Example:
A trader uses the screener to find cryptocurrencies with:
- RSI > 70: Bitcoin (BTC) has an RSI of 75, indicating it may be overbought and due for a price correction.
- RSI < 30: Ethereum (ETH) has an RSI of 25, suggesting it is oversold and may be poised for a rebound.
Example: Use RSI to detect when a coin like Bitcoin is nearing overbought territory to plan for a sell.
Explore more: What is Forex Screener? Free Trading Opportunities with a Comprehensive Tool
2. Moving Average Convergence Divergence (MACD) for Crypto Screeners
The Moving Average Convergence Divergence (MACD) is a trend-following momentum indicator that highlights the relationship between two Exponential Moving Averages (EMAs) of an asset’s price. It is widely used to identify trend changes and potential entry/exit points in the market.
Explore more: What is MACD? Full Guidance
How It Works:
- MACD Line: The difference between the 12-day EMA and the 26-day EMA.
- Signal Line: The 9-day EMA of the MACD line.
- Bullish Signal: When the MACD line crosses above the signal line, indicating potential upward momentum.
- Bearish Signal: When the MACD line crosses below the signal line, suggesting potential downward momentum.
Take Our Poll! What Features Do You Want in a Crypto Screener? Share Your Input!
Where to Open or Close Positions:
- Bullish Crossover (MACD > Signal Line):
- Open a long position when the MACD line crosses above the signal line.
- Close the position if the MACD crosses back below the signal line.
- Bearish Crossover (MACD < Signal Line):
- Open a short position when the MACD line crosses below the signal line.
- Close the position if the MACD crosses back above the signal line.
Explore more: The Evolution of Crypto Screeners: From Manual Analysis to AI-Driven Insights
Use Case in a Crypto Screeners:
Integrating MACD data into crypto screeners allows traders to filter assets based on bullish or bearish crossovers, helping them identify cryptocurrencies with potential trend changes in real-time.
Screening Data to Include:
- MACD Value: Display the current MACD value for each cryptocurrency.
- Signal Line Value: Show the current value of the signal line.
- MACD Histogram: Indicate the difference between the MACD line and the signal line.
- Crossover Status:
- Highlight cryptocurrencies where the MACD line is above the signal line (Bullish crossover).
- Highlight cryptocurrencies where the MACD line is below the signal line (Bearish crossover).
- Trending Direction: Show whether the MACD line is converging toward or diverging from the signal line.
- Timeframe: Enable users to analyze MACD data across different timeframes (e.g., 1h, 4h, 1d).
- Custom Alerts: Allow users to set alerts for MACD crossovers.
- Historical MACD Chart: Provide a visual chart displaying MACD, signal line, and histogram trends over time.
Explore more: MACD Divergence: A Comprehensive Guide for Traders
Example:
A trader uses the screener to find cryptocurrencies with:
- Bullish Crossover: Bitcoin (BTC) has a MACD line of 1.5, crossing above the signal line at 1.2, indicating upward momentum. The trader considers opening a long position.
- Bearish Crossover: Ethereum (ETH) has a MACD line of -0.8, crossing below the signal line at -0.5, signaling a potential downtrend. The trader considers opening a short position.
Example: Identify coins showing a bullish MACD crossover for potential upward momentum.
Read Related: 40 Powerful Candlestick Patterns in Forex & Crypto
3. Bollinger Bands for Crypto Screener
Bollinger Bands are volatility bands plotted above and below a moving average, often used to gauge market volatility and identify overbought or oversold conditions.
How It Works:
- Bands Adjustment:
- The bands widen during periods of high volatility.
- They contract during low volatility.
- Upper Band: Prices touching or nearing this band often signal overbought conditions, suggesting a potential price reversal or correction.
- Lower Band: Prices touching or nearing this band often indicate oversold conditions, suggesting a potential rebound or upward correction.
Read more: How to Analyze Altcoins Effectively Using a Crypto Screener
Where to Open or Close Positions:
- Overbought Conditions (Near Upper Band):
- Consider opening a short position when the price approaches or touches the upper band.
- Close the position as the price moves back toward the middle band (the moving average).
- Oversold Conditions (Near Lower Band):
- Consider opening a long position when the price touches the lower band.
- Close the position as the price moves toward the middle band.
Use Case in a Crypto Screeners:
Integrating Bollinger Bands into a crypto screener helps traders identify volatile markets or cryptocurrencies trading near the bands, providing opportunities to act on potential reversals or breakouts.
Screening Data to Include:
- Band Values:
- Upper Band: Display the current value of the upper band.
- Lower Band: Display the current value of the lower band.
- Middle Band: Show the moving average value.
- Price Location:
- Highlight cryptocurrencies trading near the upper band (overbought).
- Highlight cryptocurrencies trading near the lower band (oversold).
- Volatility Indicator:
- Show the width of the bands to indicate market volatility.
- Wider bands imply higher volatility, while narrower bands indicate a quieter market.
- Breakout Alerts:
- Highlight assets where prices are breaking above the upper band (potential upward breakout).
- Highlight assets breaking below the lower band (potential downward breakout).
- Custom Filters:
- Allow users to filter cryptocurrencies based on proximity to upper or lower bands.
- Timeframe Analysis:
- Enable analysis across different timeframes (e.g., 1h, 4h, 1d).
- Historical Band Chart:
- Provide a chart showing Bollinger Bands over time to observe price interactions.
Explore more: Crypto Whale Tracker Guide: How to Follow the Biggest Players in the Market
Example:
A trader uses the screener to find cryptocurrencies with:
- Near Upper Band: Bitcoin (BTC) is trading close to the upper band, indicating it may be overbought. The trader considers opening a short position.
- Near Lower Band: Ethereum (ETH) is trading near the lower band, suggesting it might be oversold. The trader considers opening a long position.
Example: Spot a coin nearing the lower band to anticipate a potential upward correction.

4. Moving Averages (MA and EMA) for Crypto Screener
Simple Moving Averages (SMA) and Exponential Moving Averages (EMA) are essential tools for identifying trends and potential trading opportunities. These moving averages help traders smooth out price data and highlight key support or resistance levels.
How It Works:
- Simple Moving Average (SMA):
- Calculates the average price over a specific period.
- Useful for identifying long-term trends.
- Exponential Moving Average (EMA):
- Gives more weight to recent prices, making it more responsive to price changes.
- Often used for short- to medium-term trend analysis.
Where to Open or Close Positions:
- Bullish Signal (Price > Moving Average):
- Open a long position when the price breaks above a key moving average (e.g., 50-day EMA).
- Close the position if the price drops below the moving average.
- Bearish Signal (Price < Moving Average):
- Open a short position when the price breaks below a key moving average.
- Close the position if the price rises above the moving average.
Use Case in a Crypto Screeners:
Adding moving averages to crypto screeners enables traders to filter cryptocurrencies based on their position relative to key moving averages, helping to identify bullish or bearish trends.
Screening Data to Include:
- Moving Average Values:
- Display key SMA (e.g., 50-day, 200-day) and EMA (e.g., 20-day, 50-day) values.
- Price Relation to Moving Averages:
- Highlight cryptocurrencies trading above or below selected moving averages.
- Crossover Alerts:
- Identify when shorter moving averages (e.g., 20-day EMA) cross above longer ones (e.g., 50-day EMA) for bullish signals (Golden Cross).
- Identify when shorter moving averages cross below longer ones for bearish signals (Death Cross).
- Trending Direction:
- Show whether the moving averages are sloping upward (bullish) or downward (bearish).
- Custom Filters:
- Allow users to select specific moving averages and filter assets accordingly.
- Timeframe Selection:
- Enable analysis across various timeframes (e.g., 1h, 4h, 1d).
- Historical Moving Averages Chart:
- Provide a visual chart showing the price and moving averages over time.
Example:
A trader uses the screener to find cryptocurrencies with:
- Bullish Signal: Ethereum (ETH) is trading above the 50-day EMA, indicating upward momentum. The trader considers opening a long position.
- Bearish Signal: Bitcoin (BTC) is trading below the 200-day SMA, suggesting a downtrend. The trader considers opening a short position.
Example: Use the screener to find coins breaking above the 50-day EMA, a common bullish signal.
Read more: What is Crypto Automation? Enhancing Trading Precision in the Digital Era
5. Volume for Crypto Screeners
Volume is a key metric that reflects the total number of units traded for an asset within a specific timeframe. It plays a crucial role in confirming price trends and identifying potential market opportunities.
How It Works:
- High Volume: Often signals strong market interest and precedes significant price movements. It confirms the strength of a trend.
- Low Volume: Indicates weaker trends and potential lack of market interest, suggesting caution.
Explore more: How to Use Volume to Confirm Market Trends and Read Market Sentiment
Where to Open or Close Positions:
- Open Positions:
- Enter trades in the direction of price movement when accompanied by high volume, as it confirms the trend.
- Close Positions:
- Exit trades if volume drops significantly, as this may signal weakening momentum or the end of a trend.
Read it: How to Identify Breakouts by Crypto Screener
Use Case in a Crypto Screeners:
Adding volume analysis to crypto screeners allows traders to:
- Filter assets with sudden spikes in volume, highlighting coins gaining market attention.
- Identify low-volume assets where caution is needed.
Screening Data to Include:
- Current Volume:
- Display the total trading volume for a specific timeframe (e.g., 1h, 4h, 24h).
- Volume Change (%):
- Highlight percentage changes in volume compared to the previous period (e.g., 24-hour volume change vs. prior 24 hours).
- Relative Volume (RVOL):
- Show the volume relative to the average over a set period (e.g., 10-day average).
- Volume Spikes:
- Identify cryptocurrencies with significant increases in volume within a short timeframe.
- Trending Direction:
- Combine volume with price movements to indicate whether the market is bullish or bearish.
- Custom Alerts:
- Enable users to set alerts for specific volume thresholds or percentage increases.
- Historical Volume Chart:
- Provide a visual representation of volume trends over time for selected assets.
Read: Crypto Screener vs Stock Screener
Example:
A trader uses the screener to find cryptocurrencies with:
- Sudden Volume Spike: Dogecoin (DOGE) shows a 200% increase in 24-hour volume, suggesting growing market interest. The trader analyzes price trends to decide on a potential entry point.
- Low Volume: Ripple (XRP) shows a significant drop in volume over the past 24 hours, signaling potential weakening momentum. The trader considers exiting a position.
Example: Spot coins with 24-hour volume increases to capitalize on growing market interest.
6. Stochastic Oscillator for Crypto Screener
The Stochastic Oscillator is a momentum indicator that compares a cryptocurrency’s closing price to its price range over a specified period. It is widely used to identify overbought and oversold conditions, offering insight into potential market reversals.
How It Works:
- Range: The oscillator ranges from 0 to 100.
- Overbought Conditions (Above 80): Signals the asset may be overbought, indicating a potential price correction or reversal.
- Oversold Conditions (Below 20): Signals the asset may be oversold, suggesting a potential price rebound.
Where to Open or Close Positions:
- Oversold Levels (< 20):
- Open a long position when the Stochastic Oscillator rises above 20 from oversold levels.
- Close the position as it approaches or exceeds 80.
- Overbought Levels (> 80):
- Open a short position when the Stochastic Oscillator drops below 80 from overbought levels.
- Close the position as it nears 20.
Read more: Mastering the Martingale Trading Strategy
Use Case in a Crypto Screeners:
Incorporating the Stochastic Oscillator into crypto screeners helps traders quickly identify cryptocurrencies near overbought or oversold levels, providing actionable insights for potential reversals.
Screening Data to Include:
- Stochastic Value:
- Display the current value of the Stochastic Oscillator for each cryptocurrency.
- %K and %D Values:
- Include the %K line (fast oscillator) and %D line (signal line) for more detailed analysis.
- Overbought and Oversold Alerts:
- Highlight cryptocurrencies with Stochastic values:
- Above 80 (overbought).
- Below 20 (oversold).
- Highlight cryptocurrencies with Stochastic values:
- Trending Direction:
- Show whether the oscillator is moving upward (bullish) or downward (bearish).
- Timeframe Selection:
- Allow users to analyze oscillator values across different timeframes (e.g., 1h, 4h, 1d).
- Custom Filters:
- Enable filtering for cryptocurrencies near specific Stochastic thresholds.
- Historical Oscillator Chart:
- Provide a chart visualizing Stochastic values over time for selected assets.
Read more: Best Crypto Screener for Trading
Example:
A trader uses the screener to find cryptocurrencies with:
Overbought Conditions: Binance Coin (BNB) has a Stochastic Oscillator value of 85, suggesting it may be overbought. The trader considers opening a short position if the oscillator starts dropping below 80.
Oversold Conditions: Cardano (ADA) shows a Stochastic Oscillator value of 18, indicating it is oversold. The trader considers opening a long position as the oscillator starts rising above 20.
7. Fibonacci Retracement Levels for Crypto Screener
Fibonacci Retracement Levels are tools used to identify potential support and resistance levels based on key Fibonacci ratios. These levels are crucial for predicting price pullbacks and reversals in a trending market.
How It Works:
- Key Levels: Fibonacci retracement levels are derived from ratios like 23.6%, 38.2%, 50%, 61.8%, and 100%.
- Support and Resistance:
- Price Pullbacks: Levels act as support during uptrends and resistance during downtrends.
- Commonly monitored levels include 38.2%, 50%, and 61.8%.
Where to Open or Close Positions:
- Bullish Rebound (Uptrend):
- Open a long position when the price rebounds from a key retracement level (e.g., 61.8%) and close it near the next higher level.
- Bearish Rebound (Downtrend):
- Open a short position when the price reverses from a retracement level and close it near the next lower level.
Use Case in a Crypto Screeners:
Crypto screeners with Fibonacci retracement functionality helps traders quickly identify cryptocurrencies trading near key Fibonacci levels, enabling them to plan precise entry and exit points based on price behavior around these levels.
Screening Data to Include:
- Fibonacci Levels:
- Display key retracement levels (23.6%, 38.2%, 50%, 61.8%, 100%) for each asset.
- Current Price Relation:
- Highlight cryptocurrencies trading near significant levels (e.g., within ±1% of 61.8%).
- Trend Direction:
- Indicate whether the asset is in an uptrend or downtrend based on price movement relative to Fibonacci levels.
- Custom Alerts:
- Enable users to set alerts for assets approaching specific Fibonacci levels.
- Timeframe Selection:
- Allow users to analyze Fibonacci levels across various timeframes (e.g., 1h, 4h, 1d).
- Price Bounces:
- Highlight assets showing signs of bouncing off key levels.
- Historical Chart with Fibonacci Overlay:
- Provide a chart showing historical price action with Fibonacci levels overlaid for detailed analysis.
Example:
A trader uses the screener to find cryptocurrencies with:
Bearish Opportunity: Bitcoin (BTC) is trading near the 38.2% retracement level in a downtrend, showing potential resistance. The trader considers opening a short position and targeting the 61.8% level.
Bullish Opportunity: Ethereum (ETH) is trading near the 61.8% retracement level, showing signs of a rebound. The trader considers opening a long position and targeting the 38.2% level.
8. Average True Range (ATR) for Crypto Screeners
The Average True Range (ATR) is a key indicator used to measure market volatility by calculating the average range of price movements over a specific period. It helps traders assess the potential price swings and set appropriate risk management levels.
How It Works:
- Higher ATR Values:
- Indicate greater volatility, suggesting significant price movements.
- Lower ATR Values:
- Reflect stability, indicating less price fluctuation and calmer market conditions.
Where to Open or Close Positions:
- Stop-Loss Placement:
- Use the ATR value to set dynamic stop-loss levels based on volatility. For example, place stop-losses at 1.5x or 2x the ATR value.
- High Volatility:
- Open positions during high ATR periods for swing trading opportunities.
- Low Volatility:
- Close positions as volatility stabilizes, signaling potential consolidation or trend weakening.
Use Case in a Crypto Screeners:
Crypto screeners with ATR functionality allows traders to:
- Identify cryptocurrencies with high ATR values, signaling significant price swings suitable for swing trading.
- Spot assets with low ATR values, indicating reduced volatility and potential range-bound markets.
Screening Data to Include:
- Current ATR Value:
- Display the ATR value for each cryptocurrency over a specified period (e.g., 14 days).
- Volatility Rank:
- Rank cryptocurrencies by ATR values to highlight the most volatile assets.
- ATR Change (%):
- Show percentage changes in ATR compared to the previous period.
- Custom Filters:
- Allow users to filter cryptocurrencies with ATR values exceeding a user-defined threshold.
- Timeframe Selection:
- Enable ATR analysis over different timeframes (e.g., 1h, 4h, 1d).
- Volatility Alerts:
- Notify users of cryptocurrencies experiencing sudden spikes in ATR.
- ATR Overlay on Chart:
- Provide an overlay of ATR values on a price chart for historical analysis.
Example:
A trader uses the screener to find cryptocurrencies with:
Low ATR Values: XRP shows an ATR of 2%, suggesting reduced volatility. The trader plans for a range-bound strategy or avoids trading during this period.
High ATR Values: Solana (SOL) has an ATR of 10%, indicating significant volatility. The trader considers it for swing trading opportunities.
9. Support and Resistance Levels for Crypto Screeners
Support and Resistance Levels are critical price points where an asset’s price tends to reverse, consolidate, or experience a breakout. These levels help traders identify potential entry and exit points based on market behavior.
How It Works:
- Support Levels:
- Act as price floors where demand increases, preventing further price drops.
- Resistance Levels:
- Act as price ceilings where selling pressure increases, capping further price rises.
Where to Open or Close Positions:
- Support Levels:
- Open long positions near support levels, anticipating a bounce.
- Close long positions if the price fails to hold support and breaks downward.
- Resistance Levels:
- Open short positions near resistance levels, expecting a reversal.
- Close short positions if the price breaks above resistance, signaling a potential breakout.
Use Case in a Crypto Screener:
Integrating support and resistance levels into a crypto screener enables traders to:
- Identify cryptocurrencies nearing key levels, providing actionable opportunities for potential reversals or breakouts.
- Plan targeted entry and exit strategies based on these levels.
Screening Data to Include:
- Key Support and Resistance Levels:
- Display the nearest support and resistance levels for each cryptocurrency.
- Price Proximity:
- Highlight cryptocurrencies trading within a specific percentage range of support or resistance levels (e.g., ±2%).
- Breakout Alerts:
- Notify users of cryptocurrencies breaking above resistance or below support.
- Trend Confirmation:
- Indicate whether the price is consolidating, testing, or trending toward a key level.
- Historical Interaction:
- Show the number of recent touches or tests of these levels.
- Custom Filters:
- Allow users to filter cryptocurrencies based on distance to support/resistance levels or breakout status.
- Support/Resistance Overlay on Chart:
- Provide a visual representation of key levels overlaid on a price chart for selected assets.
Example:
A trader uses the screener to find cryptocurrencies with:
Near Support: Ethereum (ETH) is hovering near a support level at $1,500, signaling a potential bounce. The trader plans a long position.
Approaching Resistance: Bitcoin (BTC) is trading near a strong resistance level at $30,000. The trader considers opening a short position or preparing for a breakout trade.
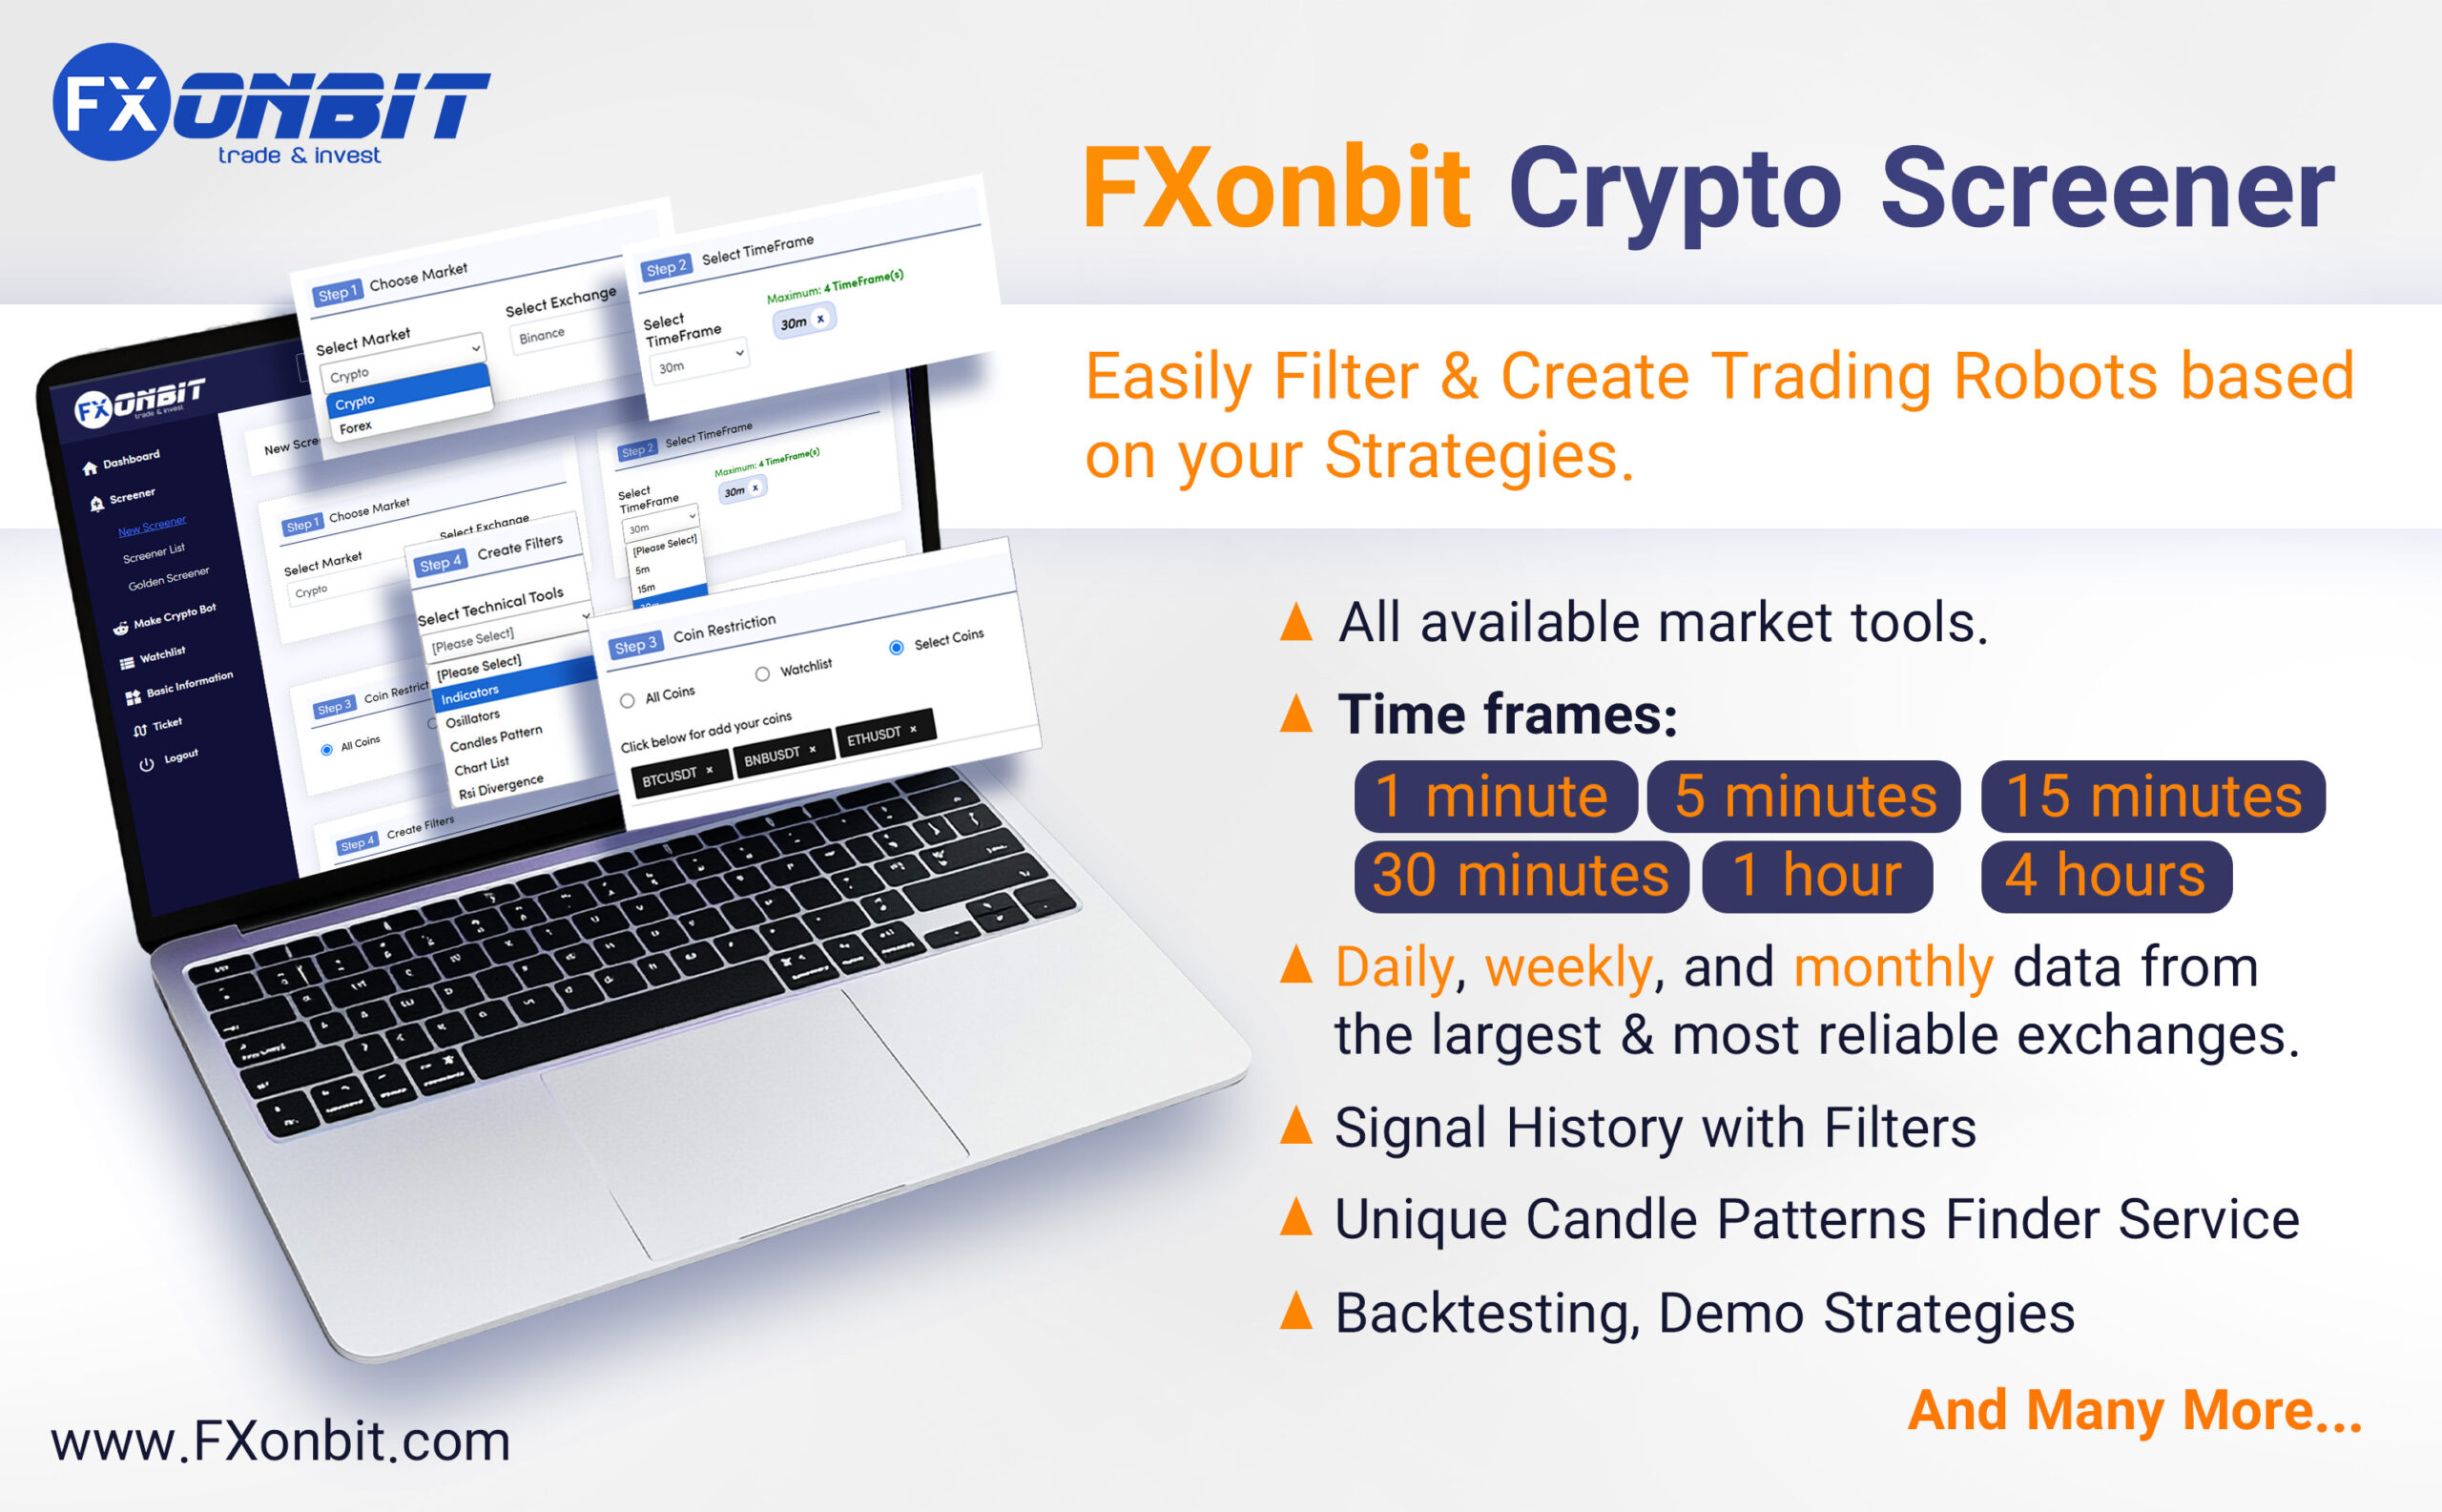
Why Use FXonbit’s Crypto Screener?
At FXonbit, we understand the importance of having all these essential indicators at your fingertips. That’s why our crypto screener is designed to provide:
- Comprehensive Indicator Support: From RSI and MACD to Fibonacci levels and Bollinger Bands.
- Customizable Filters: Tailor your screener settings to align with your unique trading strategy.
- Real-Time Updates: Stay ahead with accurate and up-to-date market data.
Start making smarter trading decisions today with FXonbit’s advanced crypto screener! Visit us at FXonbit.com to explore these powerful tools.
With the right indicators and tools, you can take your trading to the next level. Leverage FXonbit’s crypto screener to simplify market analysis and seize profitable opportunities effortlessly.
Hi, I’m Asena, a Senior Marketing Specialist with over 8 years of experience and a deep passion for trading knowledge. I have a genuine fascination with the world of Crypto and Forex markets. Over the past 6 years, I’ve dedicated myself to writing about technical analysis, fundamental analysis, and the intricate dynamics of these markets. My mission is to provide the most complete and comprehensive data to empower my audience with actionable insights. I truly love what I do and constantly strive to deliver the best possible results for my readers and users.
Asena Taremi