04 Feb

The Inverse Head and Shoulders pattern is a bullish reversal chart pattern in technical analysis, signaling a shift from a downtrend to an uptrend. It consists of three main parts: the Left Shoulder, the Head, and the Right Shoulder. When the price breaks above the Neckline, it indicates the completion of the pattern and a potential upward move. Traders use this pattern to identify market reversals and potential buying opportunities.
It signals the potential for a trend reversal, typically from a bearish to a bullish market. As traders, recognizing this pattern and understanding how to trade it can significantly improve your ability to identify lucrative trading opportunities.
Read more: Trading the Head and Shoulders Pattern: A Complete Guide
In this article, we’ll break down the Inverse Head and Shoulders pattern, its components, and how to trade it effectively.
What is the Inverse Head and Shoulders Pattern?
The Inverse Head and Shoulders pattern (also referred to as the Reverse Head and Shoulders) is a highly recognized chart pattern in technical analysis that signals a potential trend reversal in financial markets. This pattern typically emerges during a downtrend and suggests that the price is about to reverse direction, turning from a bearish trend to a bullish one.
Unlike the regular Head and Shoulders pattern, which appears in an uptrend and indicates a reversal to the downside, the Inverse Head and Shoulders forms when the price action is falling. The pattern signifies that the sellers (bears) are losing control of the market and that buyers (bulls) are beginning to dominate, setting the stage for an upward movement.
Explore more: 5 Effective Crypto Scalp Trading Strategies
Key Components of the Inverse Head and Shoulders Pattern
- Left Shoulder:
- The Left Shoulder is formed during the initial phase of the downtrend. As the price drops, it reaches a low point before experiencing a modest rally. This forms the first low, which is then followed by a short-term rebound or rise in price.
- This part represents the initial effort by sellers to push the price lower, but the buyers’ resistance begins to build up.
- Head:
- The Head is the lowest point of the pattern, following the formation of the left shoulder. After the rally from the left shoulder, the price continues to drop even lower, forming a deeper valley.
- This is the capitulation phase, where sellers push the price to its lowest level, but the market sentiment begins to shift.
- Right Shoulder:
- The Right Shoulder is the final low in the pattern, which is typically higher than the Head but still lower than the Left Shoulder. After forming the right shoulder, the price begins to rise again, signaling that buying pressure is increasing and the trend may reverse.
- The right shoulder generally mirrors the left shoulder, suggesting that the bearish momentum is weakening.
Explore more: Crypto Grid Trading Strategy Ultimate Guide for Profitable Market Trading
The Neckline and Breakout
- Neckline: The Neckline is an essential part of the Inverse Head and Shoulders pattern. It is drawn by connecting the high points of the Left Shoulder and the Right Shoulder. Once the price breaks above the neckline with significant volume, this is a clear signal that the pattern is complete and a bullish trend is likely to begin.
- Breakout: A breakout occurs when the price crosses the neckline and confirms the reversal of the downtrend. The breakout is often accompanied by an increase in volume, confirming that the buyers are now in control of the market.
Trading the Inverse Head and Shoulders Pattern
To trade the Inverse Head and Shoulders pattern successfully, traders often wait for the price to break above the neckline. This breakout signifies the end of the bearish phase and the start of an uptrend. It’s crucial to use volume as confirmation for the breakout, ensuring the move is supported by strong buying interest.
Explore more: What is Crypto Screener? The Best Crypto Screener
The Psychology Behind the Inverse Head and Shoulders
The Inverse Head and Shoulders pattern is not just a technical setup but also a reflection of the underlying market psychology. To understand how this pattern works, it’s important to break down the emotional dynamics of traders during each phase of the pattern’s formation. Here’s how the psychology of both buyers and sellers shapes the Inverse Head and Shoulders:
1. The Downtrend: Dominance of the Bears
In the beginning, the market is in a strong downtrend, where bears (sellers) are in control. Sellers have been pushing prices lower, driving the market into a bearish sentiment. As a result, traders are bearish, and the price continues to decline. The emotions here are primarily driven by fear and panic as market participants sell off their positions in anticipation of further price declines.
2. Left Shoulder: The First Signs of Reversal
As the downtrend persists, the sellers start to face resistance. Bulls (buyers) begin to step in, believing that prices have reached a level that is attractive for buying. This causes the price to rise after the first low in the pattern, creating the Left Shoulder.
At this point, the market sentiment starts to shift slightly. Buyers begin to feel more confident, but the bears are still largely in control. The price eventually begins to fall again, as the buying momentum fades. This leads to the formation of the Head, but the shift from bearish to bullish sentiment is already beginning.
3. The Head: The Final Capitulation of the Sellers
The Head marks the lowest point in the pattern, where the market reaches its extreme bearish sentiment. This is the final attempt by the sellers to push prices lower, often driven by panic selling. At this stage, fear and pessimism are at their peak, and the market seems to be in freefall.
However, after reaching the lowest point, buyers start to step in once again. The market participants who have been waiting for prices to drop to a certain level begin to buy, believing that the price is now at its lowest and will not drop further.
Read Related: 40 Powerful Candlestick Patterns in Forex & Crypto
4. Right Shoulder: Bulls Begin to Gain Strength
As the price starts to rise from the Head, a Right Shoulder forms. The Right Shoulder is typically higher than the Head but remains lower than the Left Shoulder, indicating that the sellers are losing their grip on the market. Buyers start to gain more strength, and the market sentiment becomes more optimistic.
The emotional shift is crucial here. The bulls are no longer timid about buying, and the sense of hope grows as the price begins to rally. Sellers, in contrast, begin to lose conviction, as the market fails to reach the previous lows. The Right Shoulder signals that the trend is losing momentum and the downtrend is weakening.
5. Breakout Above the Neckline: A Shift from Bearish to Bullish Sentiment
The completion of the pattern occurs when the price breaks through the neckline, a critical resistance level drawn by connecting the highs of the Left and Right Shoulders. When the price breaks above the neckline, it represents a significant psychological shift: the bears (sellers) have lost control, and the bulls (buyers) are now in charge.
This breakout marks the confirmation of the reversal from a downtrend to an uptrend. The breakout is a key moment for traders, as it signals the start of a new phase in the market. The bullish sentiment takes over, and the buyers are now confidently pushing prices higher, expecting the trend to continue.
Read more: Crypto Scalp Trading: Basic Guide
Emotional Journey from Fear to Confidence
In the Inverse Head and Shoulders pattern, the market experiences an emotional journey, transitioning from fear and pessimism (during the downtrend) to hope and optimism (during the Right Shoulder). The breakout above the neckline represents a transition from a bearish to a bullish market sentiment, driven by the belief that the downtrend is over and prices are poised to rise.
As a trader, recognizing the psychological dynamics behind this pattern can enhance your ability to spot potential reversals and make more informed decisions. Understanding these emotional shifts can help you gauge the market’s true strength, improving your overall trading strategy.
Find Out More: What is Crypto Automation? Enhancing Trading Precision in the Digital Era

How to Identify the Inverse Head and Shoulders Pattern
Identifying the Inverse Head and Shoulders pattern requires patience and careful observation. Here’s a step-by-step guide to help you recognize this reversal pattern on a price chart:
1. Look for a Downtrend
The Inverse Head and Shoulders pattern typically forms during a downtrend, signaling that the market may be poised for a reversal. The pattern begins when the price is in a steady decline, and traders are mostly bearish. This downtrend is the first part of the pattern’s structure, as the market continues to make lower lows and lower highs.
- Key point: The pattern is formed after a sustained downtrend. Ensure that the market is in a clear downtrend before looking for the pattern.
2. Locate the Left Shoulder
The Left Shoulder is the first significant low in the downtrend. It marks a temporary halt in the bearish momentum and forms when the price falls to a point of resistance from which it rebounds or rallies.
- After this low, the price typically rebounds upward to create a temporary peak (the shoulder’s top).
- The Left Shoulder represents the first signs of buying interest and the initial shift in sentiment.
- Key point: The Left Shoulder is the first trough, followed by a rise or rally that sets the stage for the next low.
3. Identify the Head
The Head represents the lowest point of the pattern and follows the Left Shoulder. After the price rises from the Left Shoulder, it eventually falls even lower than the Left Shoulder, marking the deepest part of the pattern.
- The Head must be lower than the Left and Right Shoulders. This represents the final push of sellers before the market begins to shift.
- Key point: The Head is the deepest low in the pattern, where sellers reach their maximum strength before losing control.
4. Find the Right Shoulder
The Right Shoulder forms after the price rises from the Head. This is another low, but it does not fall lower than the Head. Instead, it should be at a higher level than the Head and near the price level of the Left Shoulder. This higher low indicates that the sellers are losing strength, and buyers are starting to push the market up.
- The Right Shoulder mirrors the Left Shoulder, but it should be slightly weaker than the Head.
- Key point: The Right Shoulder is a higher low than the Head, suggesting the market is starting to lose bearish momentum.
5. Draw the Neckline
The Neckline is a critical level for confirming the completion of the Inverse Head and Shoulders pattern. The neckline is drawn by connecting the high points between the Left and Right Shoulders.
- This line represents a level of resistance in the market.
- Key point: A breakout above the neckline is what confirms the pattern, signaling that the downtrend is over and a bullish trend is beginning.
Explore more: Symmetrical Triangle Pattern: A Powerful Price Action Signal

Explore more: Top Indicators in Crypto Screeners for Effective Trading
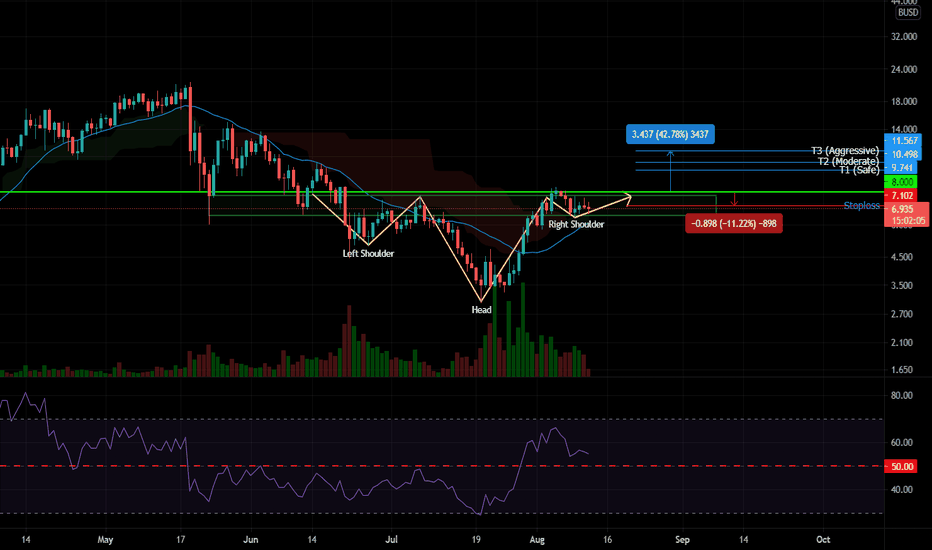
Example of the Inverse Head and Shoulders:
Imagine a downtrend where the price falls to form the Left Shoulder. After a short rally, the price dips again, creating the Head — the lowest point in the pattern. Then, after another rise, the price falls to form the Right Shoulder, which is higher than the Head. The Neckline is drawn by connecting the peaks of the Left and Right Shoulders.
Once the price breaks above the Neckline, the Inverse Head and Shoulders pattern is complete, signaling the potential start of a bullish trend.
Trading the Inverse Head and Shoulders Pattern
Once you’ve identified the Inverse Head and Shoulders pattern, it’s time to consider how to trade it. Below are the steps to trade this pattern effectively:
1. Entry Points
The ideal entry point is when the price breaks above the neckline after the right shoulder forms. This breakout indicates the start of a bullish trend. You can place a buy order slightly above the neckline to confirm the breakout and avoid false signals.
2. Stop Loss Placement
To manage risk, it’s essential to place a stop loss order below the right shoulder’s low. This helps protect you in case the pattern fails, and the price reverses unexpectedly.
3. Price Target (Profit Target)
To calculate your profit target, measure the distance from the head to the neckline. This distance represents the expected price movement after the breakout. Add this distance to the breakout point above the neckline to set your price target. For example, if the distance from the head to the neckline is $5 and the breakout occurs at $10, your target would be $15.
4. Volume Confirmation
Volume plays a significant role in confirming the breakout of the Inverse Head and Shoulders pattern. Ideally, you want to see a significant increase in volume when the price breaks above the neckline. This confirms that the breakout is legitimate and the trend reversal is likely to hold.
5. Trend Confirmation
To further validate the pattern, consider using trend-following indicators like Moving Averages or the Relative Strength Index (RSI). If the price is trading above a long-term moving average (e.g., the 200-period moving average) and RSI is showing bullish momentum, the probability of a successful breakout increases.
Read more: What is Crypto Whale Tracker? How FXonbit Empowers You to Follow Market Giants
Common Mistakes to Avoid
Even though the Inverse Head and Shoulders pattern is reliable, there are a few common mistakes traders should avoid:
- Ignoring the Neckline: The neckline is the critical level for the breakout. A pattern that doesn’t break above the neckline is not valid. Make sure the price convincingly breaks through the neckline with higher volume.
- Not Confirming with Volume: A breakout without a volume surge is less likely to be a genuine reversal. Always check the volume before entering a trade.
- Chasing the Breakout Too Early: Sometimes, the price may retest the neckline after breaking above it. Waiting for a retest of the neckline can offer a better entry point with less risk.
- Setting Unrealistic Targets: While the pattern provides a price target based on the head-to-neckline distance, it’s essential to consider market conditions and adjust your target if needed. Don’t forget to lock in profits when the price approaches your target.
Example of Inverse Head and Shoulders Trade
Let’s say you’re analyzing a stock, and you identify the Inverse Head and Shoulders pattern:
- Left Shoulder: The price declines to $50, then rebounds to $60.
- Head: The price falls to $45, then rallies to $60 again.
- Right Shoulder: The price forms a low at $48 and starts to rise again.
You draw the neckline at $60. The price then breaks above $60 with increased volume, confirming the breakout. You enter a long position at $61, place a stop loss at $47 (below the right shoulder’s low), and set your price target at $75 (the distance from the head to the neckline added to the breakout price).
Conclusion
The Inverse Head and Shoulders pattern is a powerful reversal indicator that can help traders capture significant trend reversals. By learning how to identify the pattern, trade the breakout, and manage risk effectively, you can increase your chances of success. Always remember to confirm the breakout with volume and consider using additional indicators to strengthen your analysis. With practice, you can confidently trade this pattern and improve your trading strategy.

Hi, I’m Asena, a Senior Marketing Specialist with over 8 years of experience and a deep passion for trading knowledge. I have a genuine fascination with the world of Crypto and Forex markets. Over the past 6 years, I’ve dedicated myself to writing about technical analysis, fundamental analysis, and the intricate dynamics of these markets. My mission is to provide the most complete and comprehensive data to empower my audience with actionable insights. I truly love what I do and constantly strive to deliver the best possible results for my readers and users.

Asena Taremi