23 Jul

Candlestick patterns have long been the secret language of traders, capturing the intricate dance of price action in visual form. These patterns, with their rich history and powerful predictive abilities, can transform your trading approach. Whether you’re a novice or an experienced trader, mastering candlestick patterns is key to unlocking market insights and enhancing your decision-making process.
Related to read: 40 Powerful Candlestick Patterns in Forex and Crypto Trading

Check FXonbit Custom Candlestick Patter Finder
Candlestick Patterns
Candlestick patterns are a powerful tool in technical analysis, used to forecast price movements in financial markets like stocks, forex, and cryptocurrencies. These patterns visually represent price action over time, offering insights into market sentiment and potential price direction.
Mastering candlestick patterns is crucial for traders at all levels, as they highlight key opportunities for entry and exit. Here’s what you need to know:
- Single Candlestick Patterns: Include signals like the Doji and Hammer, which indicate indecision or potential reversals.
- Multiple Candlestick Patterns: Examples are Engulfing and Morning Star, showing shifts in momentum.
- Reversal Patterns: Suggest potential trend changes (e.g., Head and Shoulders).
- Continuation Patterns: Indicate trend persistence (e.g., Bullish Flag).
Understanding these patterns enhances decision-making and provides a clearer picture of market dynamics.
Read more: FXonbit CandleStick Pattern Finder Service: Your Gateway to Smarter Forex and Crypto Trading
![]()
Single Candlestick Patterns
These are straightforward and rely on one candlestick for interpretation.

Doji
-
- Description: A small or nonexistent body with nearly equal opening and closing prices, signifying market indecision.
- Variations:
- Gravestone Doji: Indicates sellers gaining control, typically found at the top of an uptrend.
- Dragonfly Doji: Indicates buyers gaining control, usually seen after a downtrend.
- Trading Tip: Look for confirmation in the next candlestick. For example, a bullish candlestick following a Dragonfly Doji strengthens the reversal signal.
Explore more: What is Crypto Screener? The Best Crypto Screener
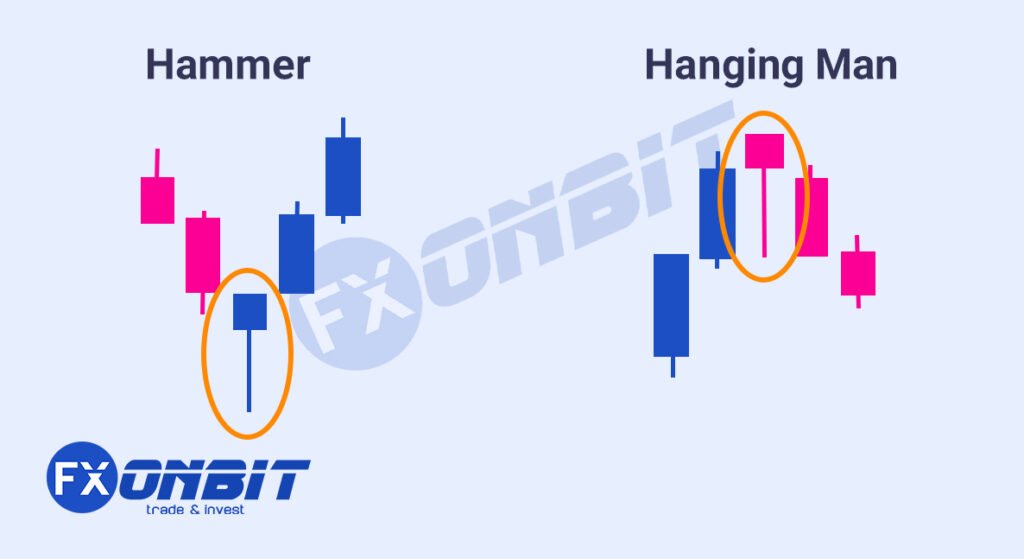
Chart Pattern: How to Trade the Ascending Channel?
Hammer and Hanging Man
-
-
- Hammer:
- Appears after a downtrend.
- Long lower shadow (at least twice the body’s length) shows strong buying pressure.
- Hanging Man:
- Appears after an uptrend.
- Long lower shadow signals potential selling pressure despite a bullish close.
- Trading Tip: Verify with volume. Higher volume strengthens the reversal signal.
- Hammer:
-
Explore more: Top Indicators in Crypto Screeners for Effective Trading
-
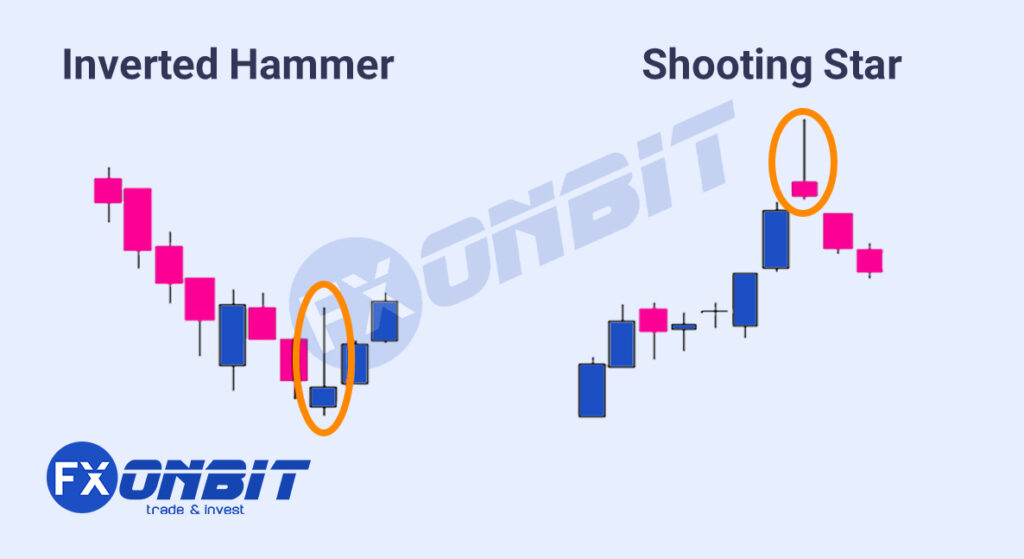
- Inverted Hammer:
- Found at the bottom of a downtrend.
- Long upper shadow indicates rejection of lower prices.
- Shooting Star:
- Found at the top of an uptrend.
- Long upper shadow shows rejection of higher prices.
- Trading Tip: Follow up with the next candlestick. A bearish confirmation after a Shooting Star confirms the reversal.
- Inverted Hammer:
Read more: Advanced Ichimoku Cloud Trading Strategies

Marubozu
-
- Description: A candlestick with no shadows, showing strong buying (Bullish Marubozu) or selling (Bearish Marubozu) momentum.
- Trading Tip: Use Marubozu as an entry signal in the direction of the trend, especially when it breaks a significant support or resistance level.
Read More: Trading Chart Patterns: What Are Chart Patterns? + PDF
Multiple Candlestick Patterns
These provide more context and reliability by using multiple candlesticks.

Engulfing Patterns
-
- Bullish Engulfing:
- A small bearish candle followed by a larger bullish candle that engulfs the previous one.
- Found in downtrends, signaling reversal.
- Bearish Engulfing:
- A small bullish candle followed by a larger bearish candle that engulfs the previous one.
- Found in uptrends, signaling reversal.
- Bullish Engulfing:
Read more: Mastering Ichimoku Cloud Trade; Specialized Topics

-
- Trading Tip: Enter the trade after the engulfing candle’s close, with a stop-loss below/above its low/high.

Harami Patterns
-
-
- Bullish Harami:
- A large bearish candle followed by a smaller bullish candle within the first candle’s body.
- Indicates reversal in downtrends.
- Bearish Harami:
- A large bullish candle followed by a smaller bearish candle within the first candle’s body.
- Indicates reversal in uptrends.
- Trading Tip: Use additional indicators (e.g., RSI) to confirm overbought/oversold conditions.
- Bullish Harami:
-
Read more: Exponential Moving Average (EMA): A Comprehensive Guide for Traders
Morning Star and Evening Star
-
-
-
- Morning Star:
- A bearish candle, a small indecisive candle (Doji/Spinning Top), and a strong bullish candle.
- Indicates a bullish reversal.
- Evening Star:
- A bullish candle, a small indecisive candle, and a strong bearish candle.
- Indicates a bearish reversal.
- Trading Tip: Confirm with higher volume on the third candle for reliability.
- Morning Star:
-
-

Chart Pattern: Bump and Run Pattern: A Comprehensive Guide
Three White Soldiers and Three Black Crows
-
-
-
-
- Three White Soldiers:
- Three consecutive bullish candles, each closing near its high.
- Indicates strong bullish momentum.
- Three Black Crows:
- Three consecutive bearish candles, each closing near its low.
- Indicates strong bearish momentum.
- Trading Tip: Be cautious of overbought/oversold signals in prolonged trends.
- Three White Soldiers:
-
-
-
Read this Chart Pattern: Bullish Rectangle Pattern: A Trader’s Complete Guide
Reversal Patterns
These suggest a change in the current trend direction.

Double Top and Double Bottom
-
- Double Top: Two peaks at similar levels, signaling a bearish reversal.
- Double Bottom: Two troughs at similar levels, signaling a bullish reversal.
- Trading Tip: Enter when the price breaks the neckline (support/resistance between the two peaks or troughs).
Explore more: Symmetrical Triangle Pattern: A Powerful Price Action Signal

-
-
- Head and Shoulders:
- A peak (shoulder), a higher peak (head), and another peak at a similar level to the first.
- Indicates a bearish reversal.
- Inverse Head and Shoulders:
- The inverse of the above, signaling a bullish reversal.
- Trading Tip: Trade the breakout of the neckline. Volume confirmation adds reliability.
- Head and Shoulders:
-
Read more: Crypto Scalp Trading: Basic Guide
-
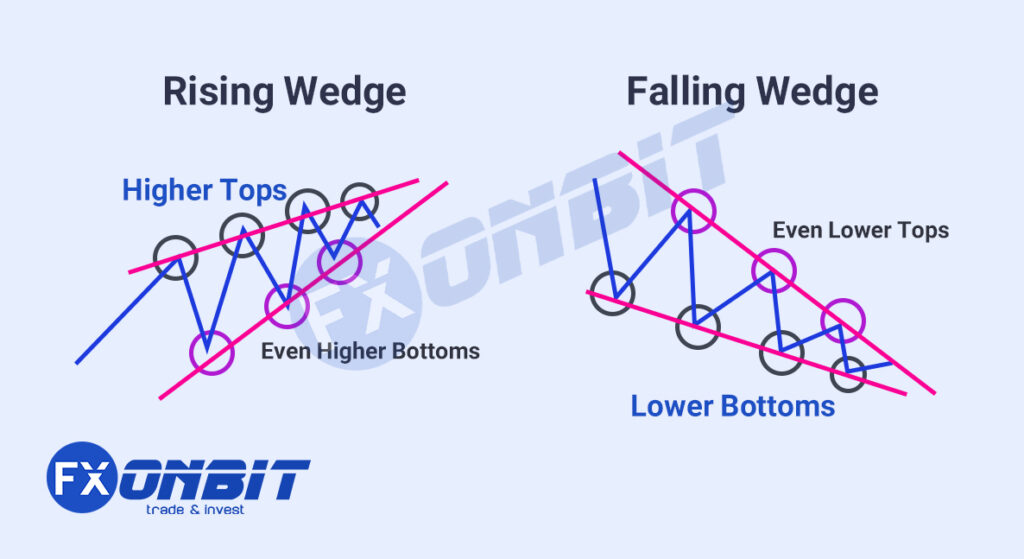
Rising and Falling Wedges
- Rising Wedge:
- Price narrows upward, indicating a bearish reversal.
- Falling Wedge:
- Price narrows downward, indicating a bullish reversal.
- Trading Tip: Watch for breakouts and enter in the direction of the breakout.
- Rising Wedge:
Basic Trading Concepts: What Is Technical Analysis?
Continuation Patterns
These suggest the trend will persist.

Triangles:
-
- Symmetrical Triangle: Neutral, breaks in the direction of the trend.
- Ascending Triangle: Bullish, higher lows converge toward resistance.
- Descending Triangle: Bearish, lower highs converge toward support.
- Trading Tip: Enter on breakout with higher volume.

Flags and Pennants:
-
-
- Flags: Rectangular pattern following a strong move.
- Pennants: Small symmetrical triangle following a sharp move.
- Trading Tip: Enter in the direction of the breakout with a target equal to the initial move’s length.
-
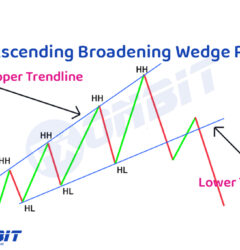
Chart: Descending Broadening Wedge Definition & Trading Strategy

General Trading Tips for All Patterns
- Volume: Always check for volume confirmation; it validates the pattern.
- Context: Patterns are more reliable in conjunction with overall market trends and support/resistance levels.
- Risk Management: Use stop-loss orders to limit risk. Patterns don’t guarantee success but improve probabilities.

Conclusion
Candlestick patterns are powerful tools for traders, providing visual insights into market sentiment and potential price movements. By mastering single candlestick patterns, multiple candlestick patterns, and understanding reversal and continuation patterns, traders can make more informed decisions and enhance their trading strategies. Remember, while candlestick patterns are useful, they should be used in conjunction with other technical analysis tools and market indicators for the best results.
With this comprehensive guide, you should have a solid foundation in candlestick patterns, equipping you with the knowledge to interpret and utilize them effectively in your trading endeavors.