23 Jul

Trend analysis is the bedrock of technical analysis, offering traders a clear roadmap to navigate market movements. By identifying trends, leveraging trendlines and channels, and distinguishing between reversals and continuations, traders can unlock the market’s potential and make informed decisions.
Read more: FXonbit CandleStick Pattern Finder Service: Your Gateway to Smarter Forex and Crypto Trading
What Is Trend Analysis?
Understanding Market Trends: Directions, Lengths, and Trend Lines
A market trend analysis is the general direction in which prices move over time. Trends are shaped by the movement of price peaks and troughs, which reflect market behavior. By analyzing these patterns, traders can identify whether a market is trending upward, downward, or sideways.
Trading Strategy: What is Scalp Trading and How to Use Algo Trading for Scalping
3 Types of Market Trends; Identifying Trends
Uptrend (Bullish Trend)
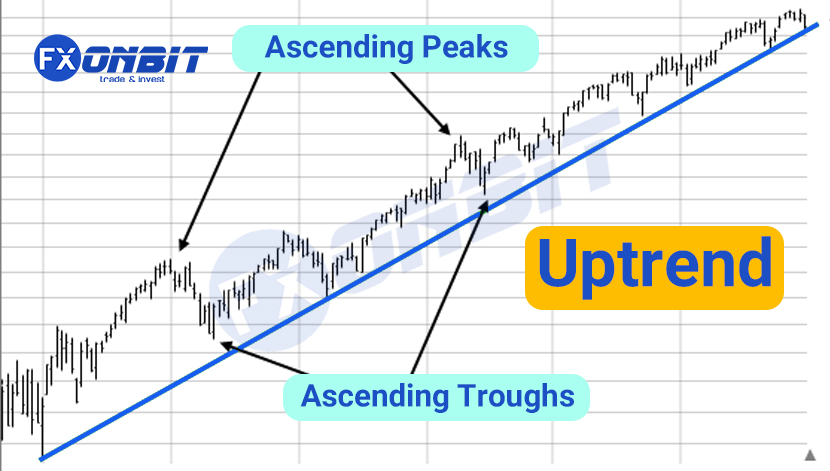
An uptrend is characterized by a series of higher highs and higher lows. It indicates that the overall market sentiment is bullish, with demand outstripping supply and pushing prices higher.
Characteristics:
- Higher Highs: Each successive peak is higher than the previous one.
- Higher Lows: Each successive trough is higher than the previous one.
- Trend Duration: Uptrends can vary in duration from short-term to long-term.
- Indicates strong demand and is often seen as a positive signal for buying opportunities.
Read more: Mastering Ichimoku Cloud Trade; Specialized Topics
Downtrend (Bearish Trend)
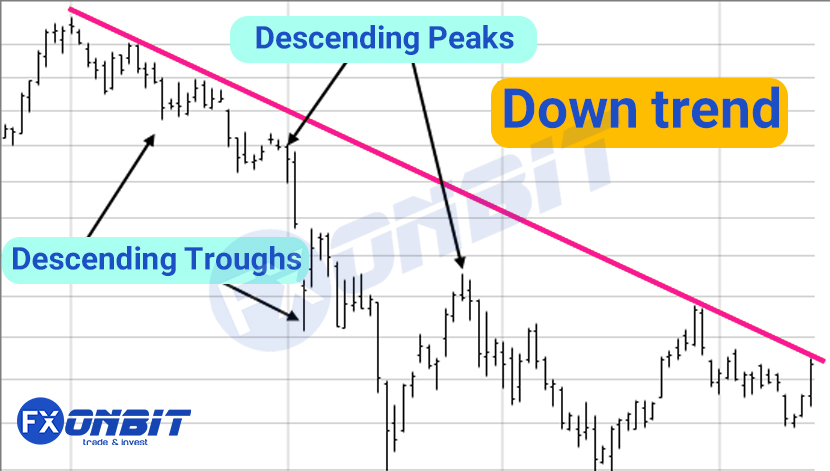
A downtrend is characterized by a series of lower highs and lower lows. It indicates that the overall market sentiment is bearish, with supply outstripping demand and pushing prices lower.
Characteristics:
- Lower Highs: Each successive peak is lower than the previous one.
- Lower Lows: Each successive trough is lower than the previous one.
- Trend Duration: Downtrends can also vary in duration from short-term to long-term.
- Suggests that selling pressure dominates, signaling potential opportunities to sell or short the market.
Explore more: What is Crypto Screener? The Best Crypto Screener
Sideways Trend (Consolidation)
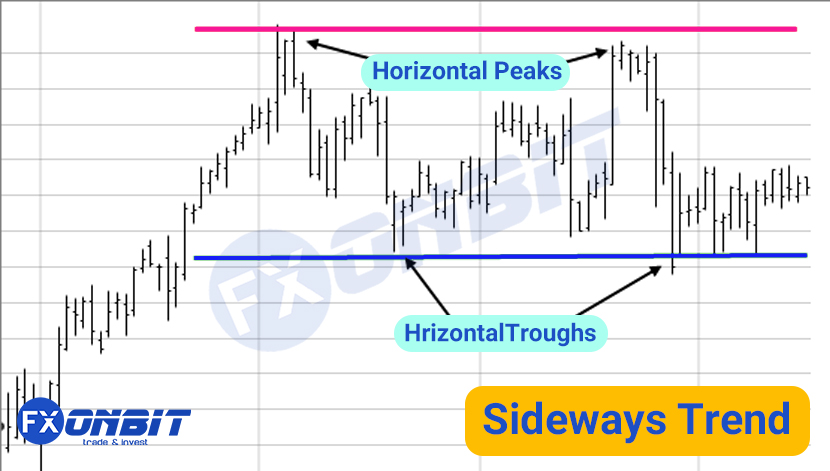
A sideways trend, also known as a horizontal or range-bound market, is characterized by relatively stable prices, with neither buyers nor sellers dominating the market. Prices fluctuate within a defined range without a clear upward or downward direction.
Explore more: 5 Effective Crypto Scalp Trading Strategies
Characteristics:
- Horizontal Movement: Prices move within a horizontal range between a support level and a resistance level.
- No Clear Direction: There is no clear trend direction, and the market moves sideways.
- Occurs when prices fluctuate within a horizontal range.
- Represents a balance between supply and demand, often leading to a breakout in either direction.
Explore more: Top Indicators in Crypto Screeners for Effective Trading

Trendlines and Channels
Trendlines and channels are essential tools in trend analysis. They help traders visually identify and confirm trends, as well as determine potential support and resistance levels.
Read this: What is a Trading Journal and How to Use It Effectively
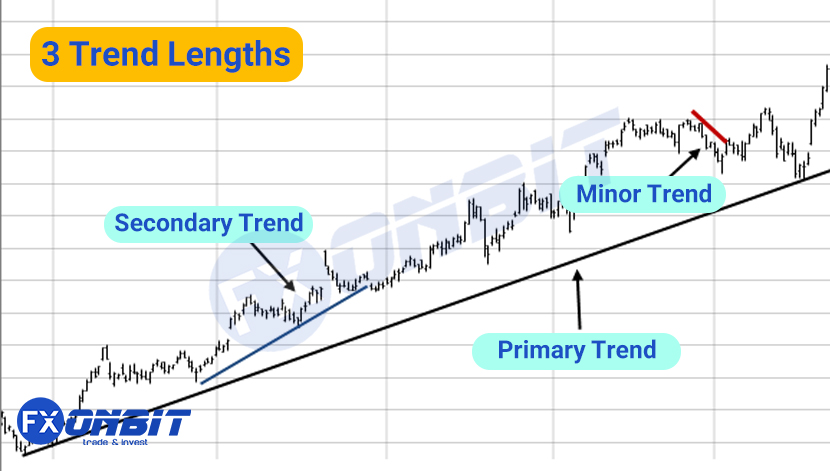
3 Trend Lengths: Inspired by Dow Theory
Charles Dow’s principles, the foundation of modern technical analysis, highlight how trends occur in waves of varying durations:
Primary Trends
- Long-term movements lasting a year or more.
- Comparable to the “tide,” these trends set the overall direction of the market.
Secondary Trends
- Medium-term trends lasting 1 to 3 months.
- Represent the “waves” within the primary trend, showing larger moves and retracements.
Minor Trends
- Short-term movements lasting less than a month.
- These are the “ripples” within the intermediate trend, reflecting day-to-day market fluctuations.
Read more: Advanced Ichimoku Cloud Trading Strategies
Interplay Between Trends:
- Long-term trends influence the size of intermediate trends, creating larger rallies in bullish conditions and deeper retracements in bearish ones.
- Short-term trends add volatility to intermediate trends, causing ebbs and flows within the broader movement.
Explore more: Symmetrical Triangle Pattern: A Powerful Price Action Signal
Trend Lines: A Tool for Identifying and Validating Trends
A trendline is a straight line that connects two or more price points and extends into the future to act as a line of support or resistance. There are two main types of trendlines: upward (support) trendlines and downward (resistance) trendlines.
Drawing Trendlines:
- Upward Trendline: Drawn by connecting two or more ascending lows. It acts as a support line and indicates that demand is increasing.
- Downward Trendline: Drawn by connecting two or more descending highs. It acts as a resistance line and indicates that supply is increasing.
Using Trendlines:
- Support and Resistance: Trendlines can act as support or resistance levels, indicating potential price reversals.
- Trend Confirmation: The more times a trendline is tested without being broken, the stronger the trend.
These trend lines are visual tools used to track the direction of a market. By connecting specific price points, they help traders recognize trends and anticipate future movements.

Uptrend Lines
- Drawn by connecting two or more ascending lows.
- A rising trend line indicates strong demand, with prices consistently staying above the line.
- If prices break below the trend line, it could signal a potential trend reversal.
Downtrend Lines
- Created by linking two or more descending highs.
- A falling trend line suggests that supply outweighs demand, keeping prices below the line.
- A breakout above the trend line often hints at a reversal toward bullish conditions.

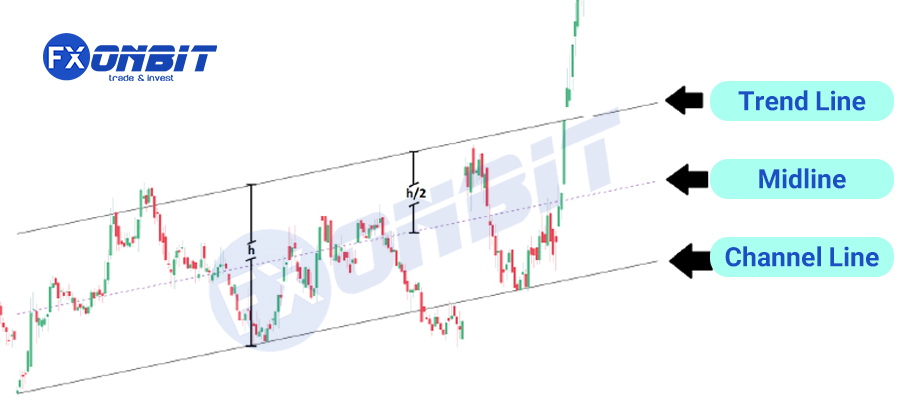
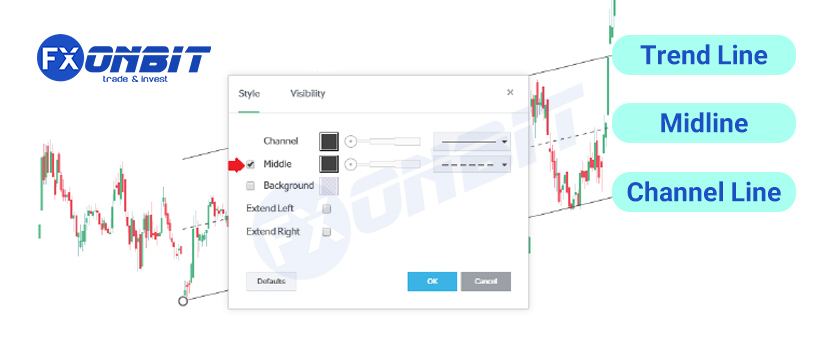
Trend Line: In an uptrend, trend lines are drawn by connecting the lows, and in a downtrend, they are drawn by connecting the highs. These lines represent the best entry zones.
Channel Line: The channel line is parallel to the trend line and marks the best exit zones.
Midline: The midline is positioned between the trend line and the channel line. It is where the most significant price reactions occur. Suitable areas for exiting short-term trades and re-entering in the direction of the trend are around the midline, especially if it breaks.
Why Trend Lines Matter:
- They act as dynamic support and resistance levels.
- Provide traders with a framework to set entry and exit points.
- Help confirm the continuation or reversal of a trend.
Channels
Channels are formed by drawing two parallel trendlines: one connecting the highs and one connecting the lows of a trend. Channels help traders identify the upper and lower boundaries of a trend, providing a clearer picture of the price range.
Types of Channels:
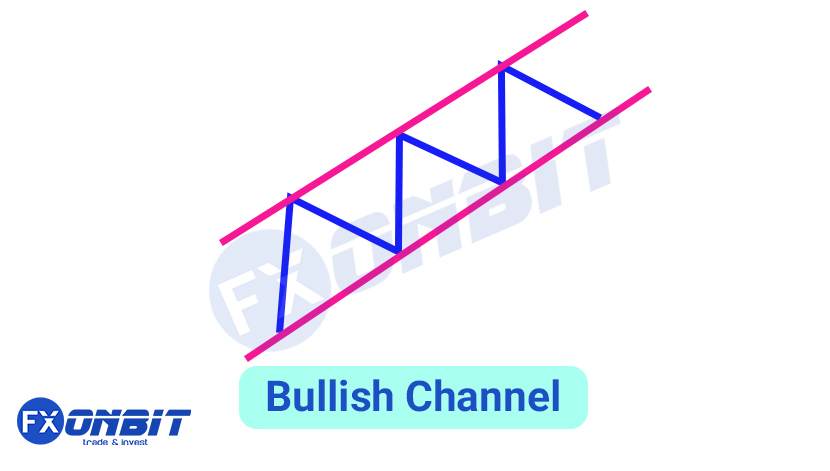
Ascending Channel: Formed in an uptrend, with the upper trendline connecting higher highs and the lower trendline connecting higher lows.
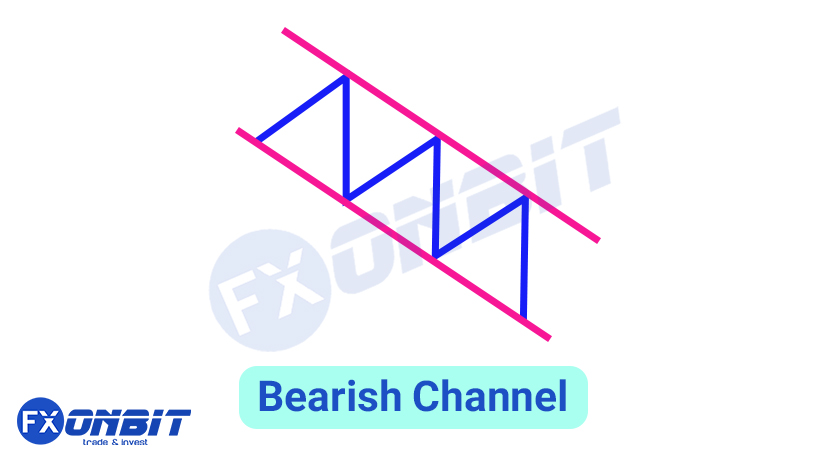
- Descending Channel: Formed in a downtrend, with the upper trendline connecting lower highs and the lower trendline connecting lower lows.
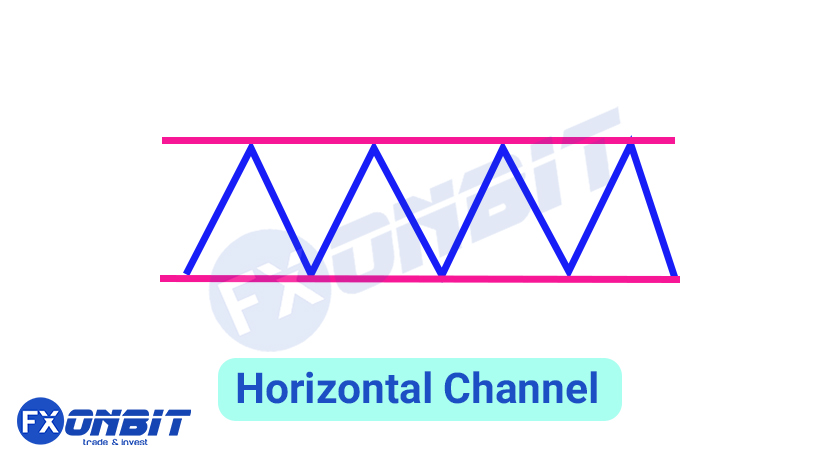
- Horizontal Channel: Formed in a sideways trend, with parallel trendlines connecting the highs and lows of the range.
Using Channels:
- Buy and Sell Signals: Traders often buy near the lower trendline and sell near the upper trendline.
- Breakouts: A breakout above or below the channel can indicate a significant change in trend direction.

Trend Reversals vs. Continuations
Distinguishing between trend reversals and continuations is crucial for making informed trading decisions. Identifying whether a trend is likely to continue or reverse can help traders position themselves appropriately.
Trend Reversals
A trend reversal occurs when the direction of the current trend changes. Reversals can be identified through various technical indicators and patterns.
Indicators of Trend Reversals:
- Divergence: When the price is making higher highs in an uptrend or lower lows in a downtrend, but the indicator (such as RSI or MACD) is moving in the opposite direction, it signals a potential reversal.
- Candlestick Patterns: Patterns such as the Head and Shoulders, Double Top, Double Bottom, and Hammer can indicate trend reversals.
- Break of Trendline: When the price breaks through a well-established trendline, it can signal a trend reversal.
Common Reversal Patterns:
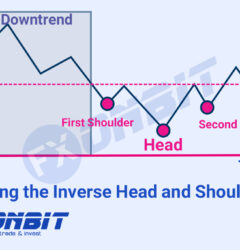
- Head and Shoulders: Indicates a bearish reversal after an uptrend.
- Inverse Head and Shoulders: Indicates a bullish reversal after a downtrend.
- Double Top: Indicates a bearish reversal after an uptrend.
- Double Bottom: Indicates a bullish reversal after a downtrend.

Trend Continuations
A trend continuation occurs when the current trend persists. Continuation patterns and indicators help traders identify periods of consolidation within a trend, suggesting that the trend is likely to resume.
Indicators of Trend Continuations:
- Trend-following Indicators: Indicators such as moving averages (MA) and the Average Directional Index (ADX) can help confirm the strength of a trend.
- Pullbacks and Corrections: Minor pullbacks or corrections within a trend are often seen as opportunities to enter or add to a position in the direction of the trend.
Common Continuation Patterns:
- Triangles: Ascending, descending, and symmetrical triangles often signal trend continuations.
- Flags and Pennants: Short-term consolidation patterns that indicate the trend is likely to continue after a brief pause.
- Rectangles: A period of horizontal consolidation that suggests the trend will resume after the consolidation phase.
Practical Applications of Trend Analysis
Understanding and applying trend analysis can significantly enhance trading strategies. Here are some practical applications:
Trading Strategies
Trend-following Strategies:
- Moving Averages: Use moving averages to identify and confirm trends. For example, a trader might use a combination of short-term and long-term moving averages (e.g., 50-day and 200-day MA) to identify trend direction and make trading decisions based on crossovers.
- Trendline Breaks: Trade based on the break of a trendline. For example, a trader might enter a long position when the price breaks above a descending trendline or enter a short position when the price breaks below an ascending trendline.
Counter-trend Strategies:
- Divergence: Use divergence between price and indicators to identify potential trend reversals. For example, if the price is making higher highs but the RSI is making lower highs, a trader might anticipate a bearish reversal and position accordingly.
- Reversal Patterns: Trade based on reversal patterns such as Head and Shoulders or Double Tops/Bottoms. For example, a trader might enter a short position after confirming a Head and Shoulders pattern.
Risk Management
Stop-loss Orders:
- Trendline-based Stop-loss: Place stop-loss orders below trendline support in an uptrend or above trendline resistance in a downtrend to manage risk and protect profits.
- Pattern-based Stop-loss: Use reversal or continuation patterns to set stop-loss levels. For example, place a stop-loss order below the lower boundary of a flag pattern in an uptrend.
Position Sizing:
- Trend Strength: Adjust position size based on the strength of the trend. For example, in a strong uptrend, a trader might increase position size, while in a weak or uncertain trend, the trader might reduce position size.
Conclusion
Trend analysis is an essential aspect of technical analysis, providing traders with valuable insights into market direction and potential price movements. By mastering the identification of trends, utilizing trendlines and channels, and distinguishing between trend reversals and continuations, traders can develop robust trading strategies and enhance their decision-making process. This comprehensive guide equips you with the knowledge to effectively analyze trends and apply this analysis to your trading endeavors, empowering you to navigate the financial markets with confidence and precision.