29 Jan
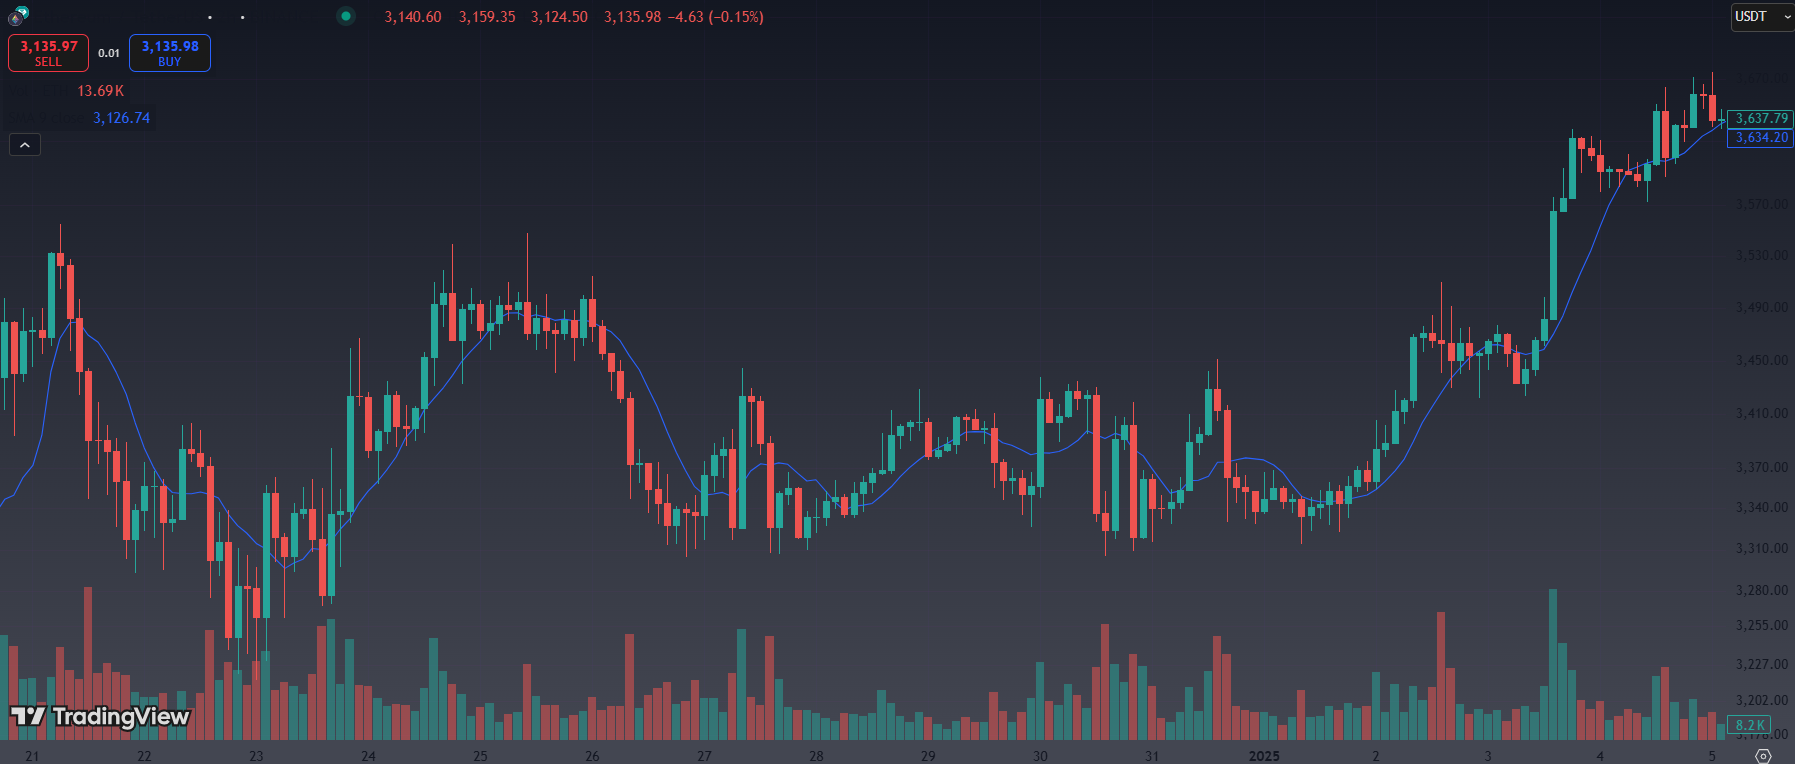
If you’re new to trading, you’ve likely heard the term “volume” thrown around, but what does it actually mean? In simple terms, volume refers to the total number of shares, contracts, or cryptocurrency units traded during a specific period. It’s a fundamental concept that can provide valuable insights into market activity and help traders make more informed decisions.
This article will explore the concept of volume trading basic and explain its importance in market analysis.
Find Volume in Our Free Crypto & Forex Screener Dashboard

What is Volume in Volume? (Volume Trading Basic)
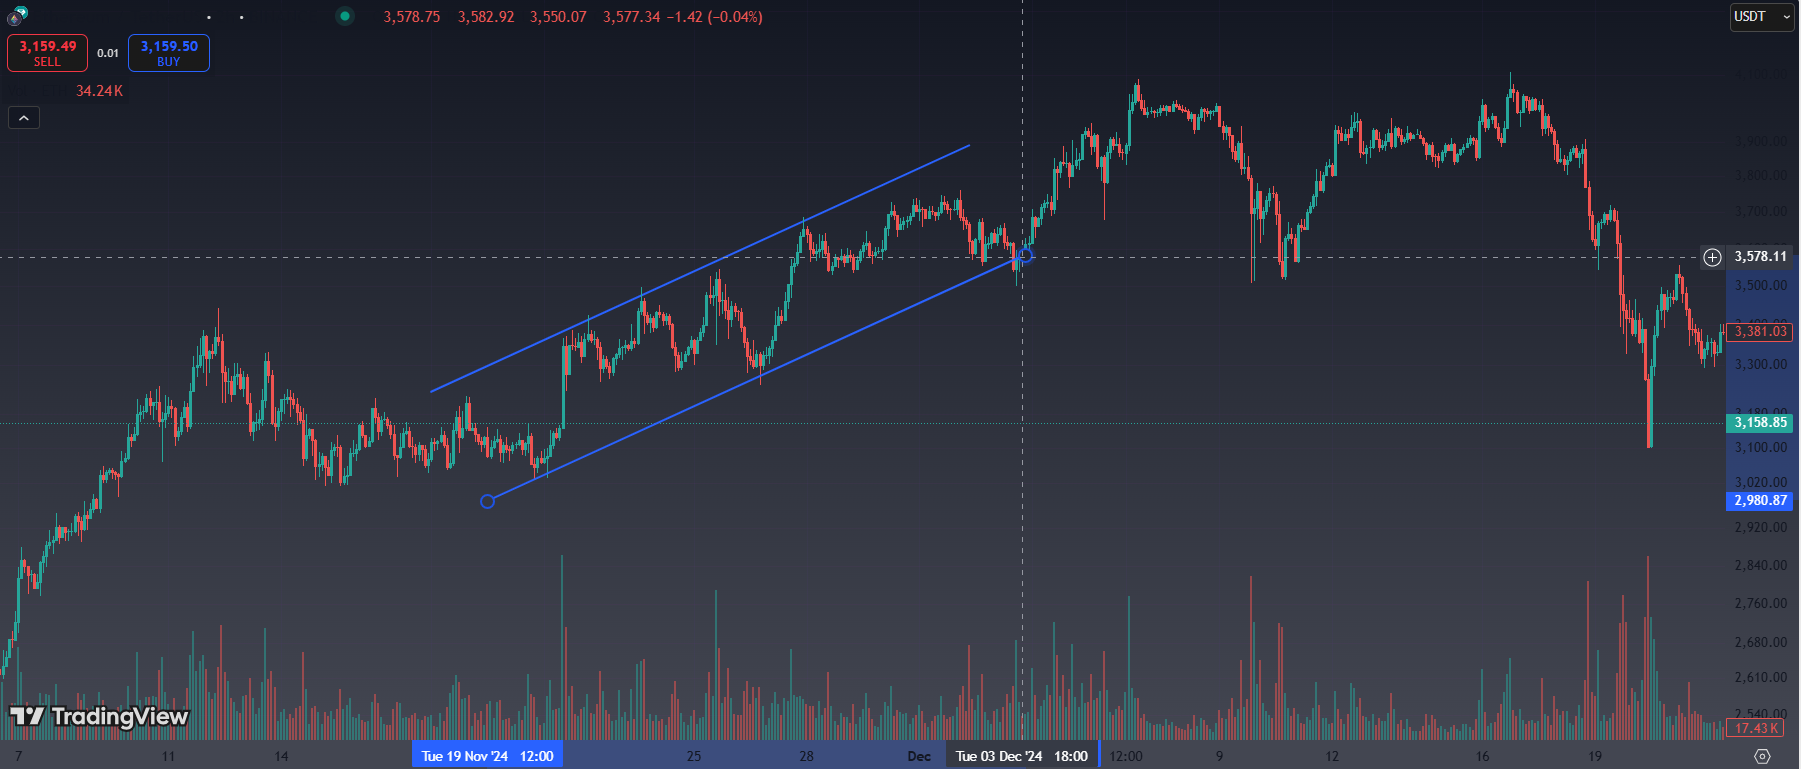
In trading, volume refers to the total number of units (stocks, contracts, or cryptocurrency tokens) that are bought and sold during a specified period. It is a crucial metric because it reflects the activity level of market participants, showing how many trades are being executed.
Volume is often measured over a specific time frame, such as one minute, one hour, or one day, and can vary significantly based on market conditions. For example, during major market events or announcements, trading volume can spike, while during periods of uncertainty or low news flow, volume might decrease.
Explore more: Filtering High-Volume Cryptos: Guide to Finding Liquidity with Screeners

Volume as an Indicator of Market Strength
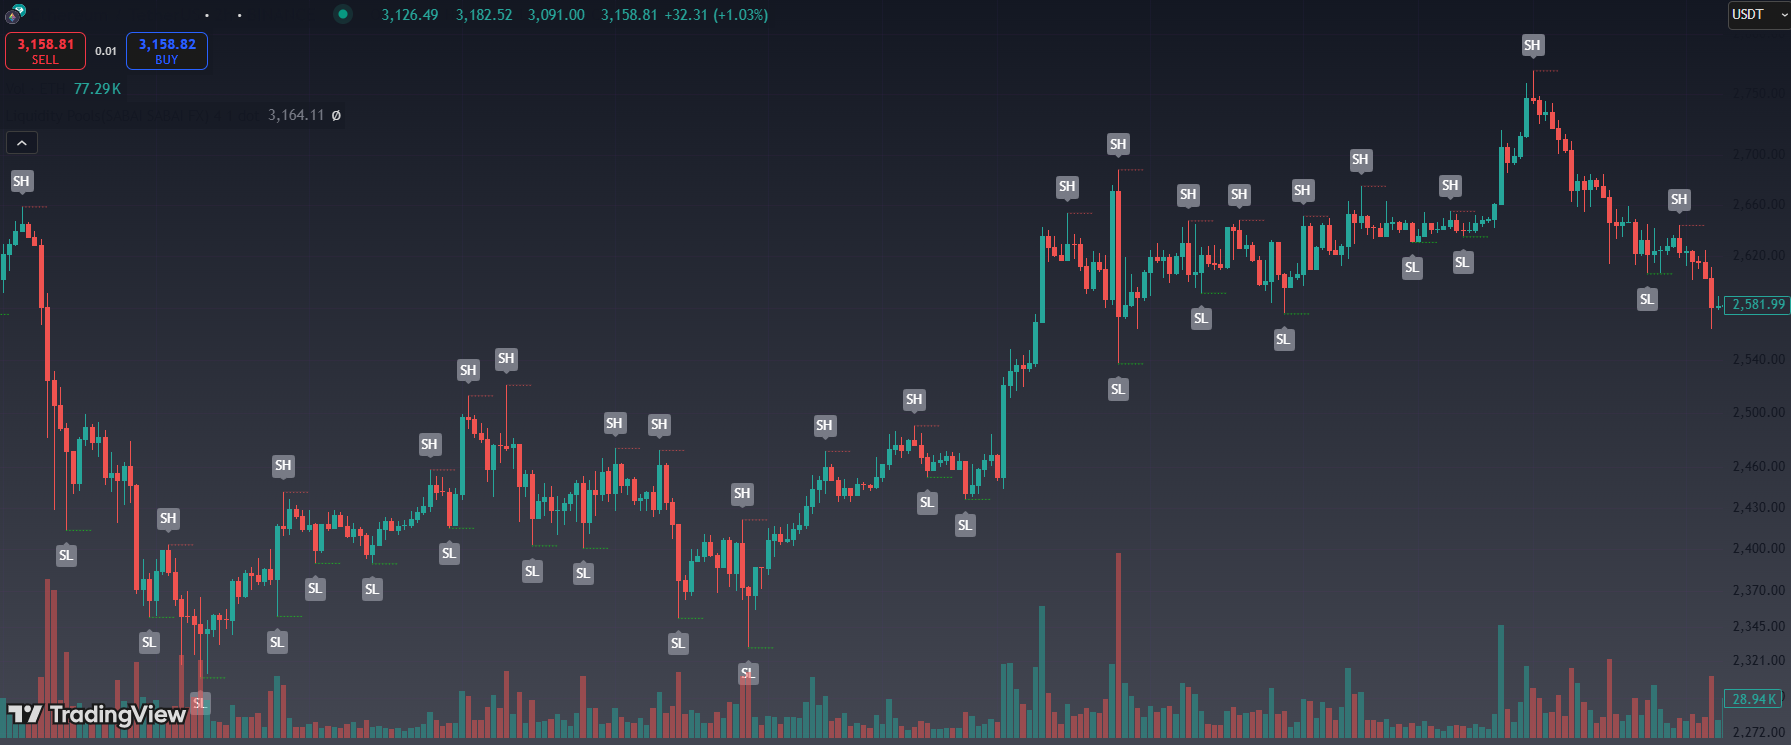
The level of volume in a market gives traders insight into the strength or weakness of a price movement. This is because volume can confirm or contradict price movements, helping traders understand whether the price action is backed by strong market interest.
Explore more: MACD Divergence: A Comprehensive Guide for Traders
- High Volume: When a market experiences a significant price movement, whether upward or downward, and it is accompanied by high volume, it signals that many traders are involved, indicating strong market interest. This can confirm that the price move is supported by a broad consensus, making it more likely to continue.For example, if the price of a stock rises sharply with a corresponding surge in volume, it suggests that the buying interest is strong, and the upward trend is likely to continue. Conversely, if the price rises but the volume remains low, it may indicate that fewer traders are involved, making the price move potentially unsustainable.
- Low Volume: On the other hand, if a market shows a large price movement but the volume is low, it could be a warning sign that the trend is weak or that the price change is due to a smaller number of traders, possibly leading to a reversal or a lack of continuation. Low volume often signals indecision in the market, where fewer participants are making trades, which can result in more volatile and less predictable price action.
Explore more: How to Use Volume to Confirm Market Trends and Read Market Sentiment
The Importance of Volume in Trend Confirmation
Volume plays a crucial role in confirming trends. For example, when a trend is supported by high volume, it confirms the validity of the trend. Traders will often wait for volume to confirm a price breakout from a key level of support or resistance. If the breakout is accompanied by high volume, it suggests a more robust move with higher conviction from market participants.
For instance, in a bullish breakout where the price moves above a resistance level, a high-volume surge can indicate that the price is likely to keep rising. However, if the breakout occurs with low volume, the move may not have enough support, and the price could quickly retreat back below the resistance level.
Explore more: Top Indicators in Crypto Screeners for Effective Trading
Volume and Reversals
Volume is also critical when identifying potential reversals in the market. For example, when a market has been in a prolonged downtrend and suddenly experiences a significant volume spike, it might indicate that the selling pressure is weakening, and a reversal could be near. The surge in volume often shows that traders are beginning to take profits or shift their positions, suggesting that the trend could be changing.

Conversely, volume decreases during the later stages of a price move, especially during an uptrend, suggesting that interest in the asset is fading, and the market may be ready for a correction.
Read more: Maximize Your Crypto Profits with a Crypto Screener
Volume and Liquidity
Another important aspect of volume is its direct relationship with liquidity. Higher volume means there are more buyers and sellers in the market, which generally results in smoother price movements and less slippage. In markets with low volume, there can be larger price gaps between bids and asks, leading to less efficient executions of trades. This makes it harder to enter or exit positions without significantly affecting the market price.
Explore more: Crypto Grid Trading Strategy Ultimate Guide for Profitable Market Trading
Why is Volume Important in Trading?
Volume is an essential indicator in trading because it provides valuable insights into market sentiment and the strength of a price move. Understanding volume helps traders gauge whether a market trend is sustainable or if a reversal might be coming. Here’s a more detailed explanation of why volume is so important:
Explore more: Volume Analysis for Day Traders: How to Maximize Profits
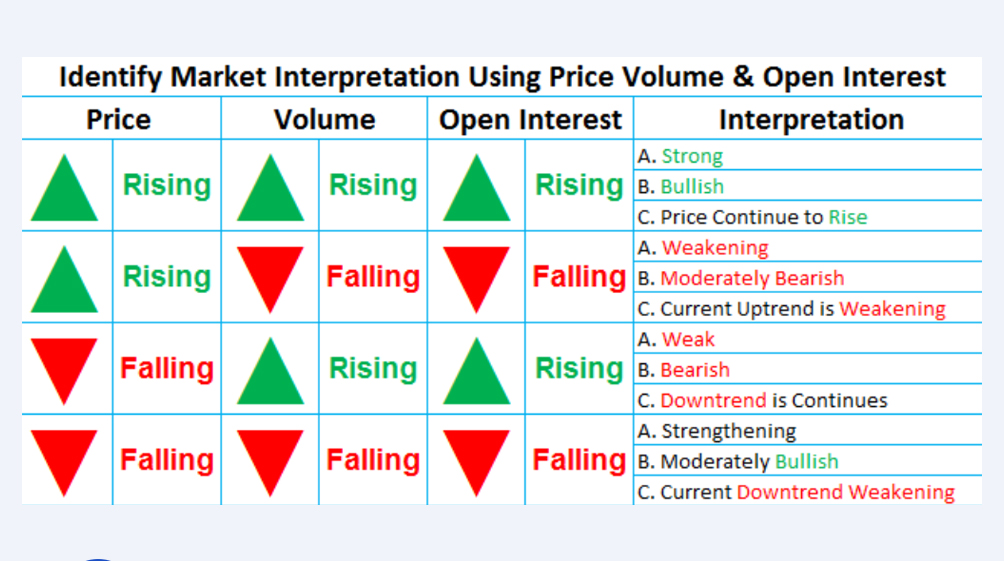
1. Trend Confirmation
Volume plays a key role in confirming the direction of a trend.
- Increasing Volume in an Uptrend: When the price of an asset moves upwards, and this movement is accompanied by increasing volume, it suggests that there is strong interest in the asset. This indicates that many traders are involved in the market, and the uptrend is likely to continue. Higher participation adds credibility to the trend, making it more robust.
- Decreasing Volume in an Uptrend: On the other hand, if the price is rising but the volume is low or decreasing, it can signal that fewer participants are backing the move. This lack of interest could lead to a trend reversal or a stagnant market. Similarly, if a downtrend is accompanied by falling volume, it may indicate that the selling pressure is weakening and a potential trend reversal is near.
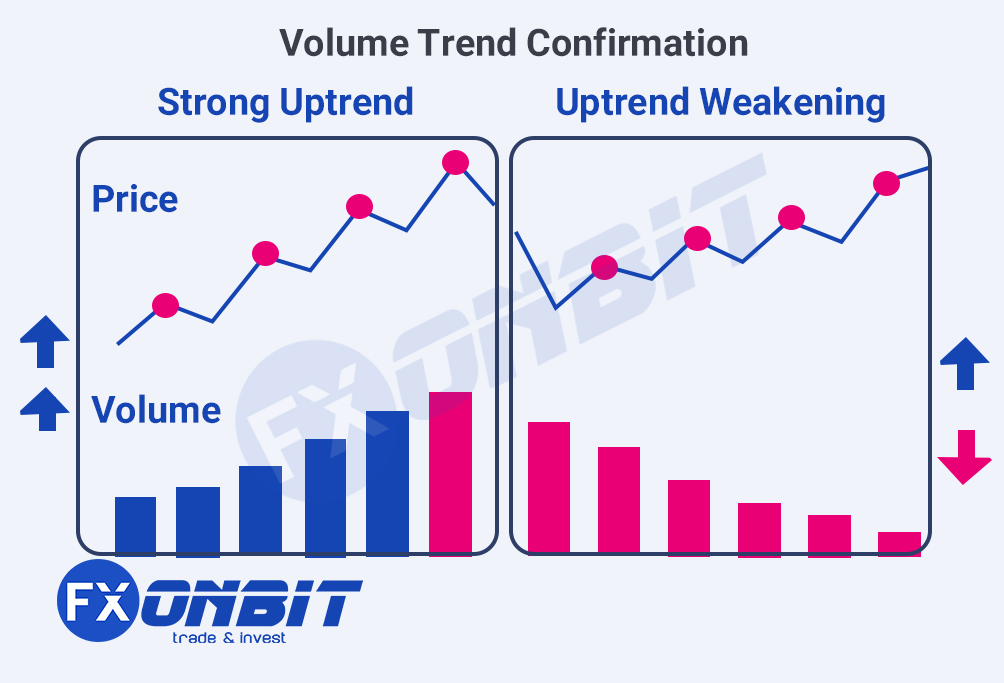
In short, when the trend and volume are in sync, it makes the price movement more reliable. If volume increases during a price movement, it supports the strength of the trend, while low volume signals caution.
Read more: Advanced Ichimoku Cloud Trading Strategies
2. Spotting Market Reversals
One of the most powerful uses of volume is in spotting potential market reversals.
- Volume Spikes Precede Reversals: Often, when a long-term trend (either up or down) starts to show signs of reversal, volume tends to spike. A volume spike during a downtrend may indicate that the selling pressure is losing strength, and buyers could be coming in, signaling a potential reversal to the upside. Similarly, a volume surge during an uptrend might suggest that the buying momentum is peaking, and a reversal could be imminent.
- Recognizing Volume Before a Reversal: Volume is crucial in identifying these changes in momentum early. By noticing volume shifts in advance, traders can adjust their positions before significant price changes occur. Recognizing volume spikes or changes in volume during trends can act as an early warning system for potential market turnarounds.
Read it: 40 Powerful Candlestick Patterns in Forex and Crypto Trading
3. Liquidity and Market Participation
Volume is closely tied to liquidity, which refers to how easily assets can be bought or sold without causing significant changes in price.
- High Volume: In markets with high volume, it’s easier for traders to enter and exit positions without drastically moving the price. High liquidity means there are more participants, making the market more stable. It reduces the chances of slippage (when the price moves unfavorably before a trade is executed), and transactions can be completed quickly at expected prices.
- Low Volume: Conversely, low volume can lead to low liquidity, which can result in larger price swings, slippage, and difficulty executing trades at the desired price. In thinly traded markets, even a small trade can cause significant price movement, making it riskier for traders. Low volume can also signal that there aren’t enough buyers or sellers to support price stability.
By watching volume, traders can assess the liquidity of a market and make more informed decisions about the ease with which they can enter or exit trades.
Read more: FXonbit CandleStick Pattern Finder Service: Your Gateway to Smarter Forex and Crypto Trading
4. Price Breakouts and Fakeouts
Volume is a crucial factor when evaluating price breakouts and determining whether they are legitimate or just a fakeout.
- High Volume During Breakouts: A price breakout occurs when the price moves beyond a key support or resistance level. When this happens and is accompanied by high volume, it indicates that the breakout is legitimate and backed by strong market interest. Traders will often look for such high-volume breakouts to confirm the trend and join the movement.
- Low Volume During Breakouts: On the other hand, a price move that occurs with low volume might be a false breakout or a “fakeout.” In this case, the move could quickly reverse, and traders may find themselves in a losing position. If a breakout occurs on low volume, it suggests a lack of conviction in the market, and the move may not be sustainable.
For traders, it’s essential to confirm the legitimacy of a breakout using volume. A breakout without volume backing it up might be an unreliable signal, whereas a strong volume surge reinforces the breakout’s potential for continued movement in the direction of the price change.
Read more: Weighted Moving Average (WMA): A Comprehensive Guide for Traders
Volume is not just a number—it provides vital insights into the health and strength of a market trend. By observing how volume behaves alongside price changes, traders can better assess whether a trend is likely to continue, spot potential reversals, understand market liquidity, and identify the legitimacy of breakouts.
To sum up:
- High volume during a price move shows strength and market conviction.
- Low volume can signal weakness, indecision, or a potential reversal.
- Volume spikes often precede trend changes, offering traders an edge in recognizing shifts in market sentiment.
Understanding and interpreting volume effectively is a powerful tool in trading, helping you make better, more informed decisions.
Explore more: How to Combine Technical Indicators for More Accurate Trade Signals

How to Interpret Volume Data?
Interpreting volume data is a crucial skill for traders. It’s not just about the raw numbers; it’s about understanding what the volume levels tell you in the context of price movements. Here’s how you can interpret volume data to make more informed trading decisions:
a. High Volume
What It Means:
- High volume indicates that a lot of market participants are active and trading the asset. This suggests that the price movement is supported by strong participation and conviction from traders.
- A high volume move is more likely to be sustained, meaning that a trend supported by high volume has a greater chance of continuing.
When to Look for It:
- If you see prices moving significantly up or down on high volume, it usually confirms that the trend is valid and there is strong market interest behind it.
How to Use It:
- When prices are trending upward or downward with increasing volume, you can be more confident that the trend is genuine and that it has strong backing from the market.
Find Out More: What is Crypto Automation? Enhancing Trading Precision in the Digital Era
b. Low Volume
What It Means:
- Low volume signals a lack of market participation or interest. When volume is low, there are fewer trades happening, which makes price movements less reliable.
- A price movement that occurs on low volume is more likely to be unsustainable and could easily reverse.
When to Look for It:
- If price is moving higher or lower, but the volume remains low, it may indicate that there isn’t enough interest in continuing the trend.
How to Use It:
- A price move on low volume could be a false signal. For example, a price increase with low volume may look like an uptrend, but the lack of participation could mean that the movement is temporary and might quickly reverse.
Explore more: What is Crypto Screener? The Best Crypto Screener
c. Volume Spikes
What It Means:
- A volume spike is when the trading volume surges significantly above its normal range. This often happens during major market events such as news releases, earnings reports, or any event that has the potential to cause a sharp price movement.
- A spike in volume suggests that something significant is happening in the market, causing a lot of traders to act at once.
When to Look for It:
- Volume spikes can occur during breaking news, earnings announcements, or unexpected market events. These events create uncertainty, causing both buyers and sellers to react quickly, which is reflected in the volume surge.
How to Use It:
- A volume spike often signals a change in market sentiment or a trend shift. For instance, if a stock has been in a downtrend and you notice a sudden volume spike, it might suggest that buyers are coming in, and a reversal is possible.
- Important: Always assess the volume spike alongside price action. If the price moves significantly in the direction of the volume spike, it strengthens the belief that the move is legitimate.
Read more: Mastering the Martingale Trading Strategy
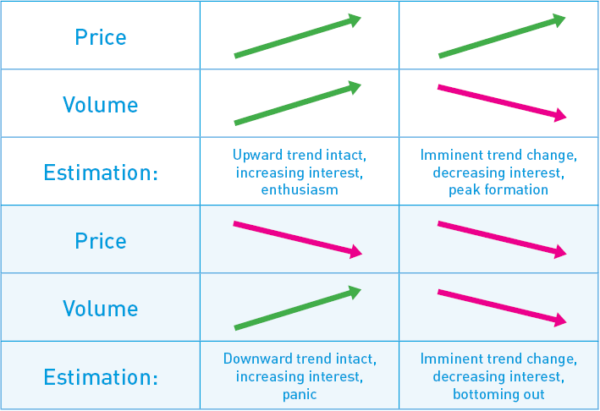
d. Volume and Price Correlation
What It Means:
- Volume and price correlation helps to validate or question a price movement. Volume is most useful when you pair it with price action to assess the strength or weakness of a move.
How to Interpret It:
- Price Rises with Increasing Volume: This is a strong confirmation that the uptrend is backed by market participation. Higher volume means more traders are supporting the rise, so the trend is more likely to continue.
- Price Rises with Decreasing Volume: This can be a warning sign that the uptrend is losing strength. When the price is moving higher but the volume is shrinking, it suggests that fewer traders are backing the move, which may indicate that the trend is running out of steam and could reverse.
- Price Falls with Increasing Volume: If the price drops and is accompanied by increasing volume, it suggests that selling pressure is strong, and the downtrend could continue.
- Price Falls with Decreasing Volume: If the price drops but the volume is declining, it may signal that there is less selling interest, and the downtrend could be losing momentum, potentially leading to a reversal.
Read it: How to Identify Breakouts by Crypto Screener
To interpret volume data effectively, you need to consider both the absolute volume and the context of the price movement. High volume confirms the strength of a trend, while low volume may suggest indecision or a false move. Volume spikes are often indicators of major market events or trend reversals, and the correlation between volume and price can help you gauge whether a trend is likely to continue or if it’s losing momentum.
By consistently evaluating volume alongside price movements, you’ll be able to make more informed decisions about whether to enter or exit trades, spot potential market reversals, and understand the true strength of market trends. Volume is a powerful tool in any trader’s arsenal, and when used correctly, it can improve the accuracy of your trades and help you navigate the markets with confidence.

Common Volume Indicators
Volume indicators are essential tools for technical analysis, providing deeper insights into market trends by combining volume with price action.
Here are some popular volume indicators that traders use to interpret market behavior:
a. On-Balance Volume (OBV)
What It Is: On-Balance Volume (OBV) is a volume-based indicator that combines price and volume to indicate whether a security is being accumulated (bought) or distributed (sold). The OBV line rises when the price closes higher than the previous period’s close, and it falls when the price closes lower.
How It Works:
- Rising OBV: A rising OBV suggests that the asset is under accumulation by buyers, meaning that there is more buying than selling pressure. This is generally considered a bullish signal.
- Falling OBV: A declining OBV signals that the asset is being distributed by sellers, meaning that there is more selling pressure. This is typically seen as a bearish signal.
Explore more: Resistance Breakout (Breakout) in Technical Analysis
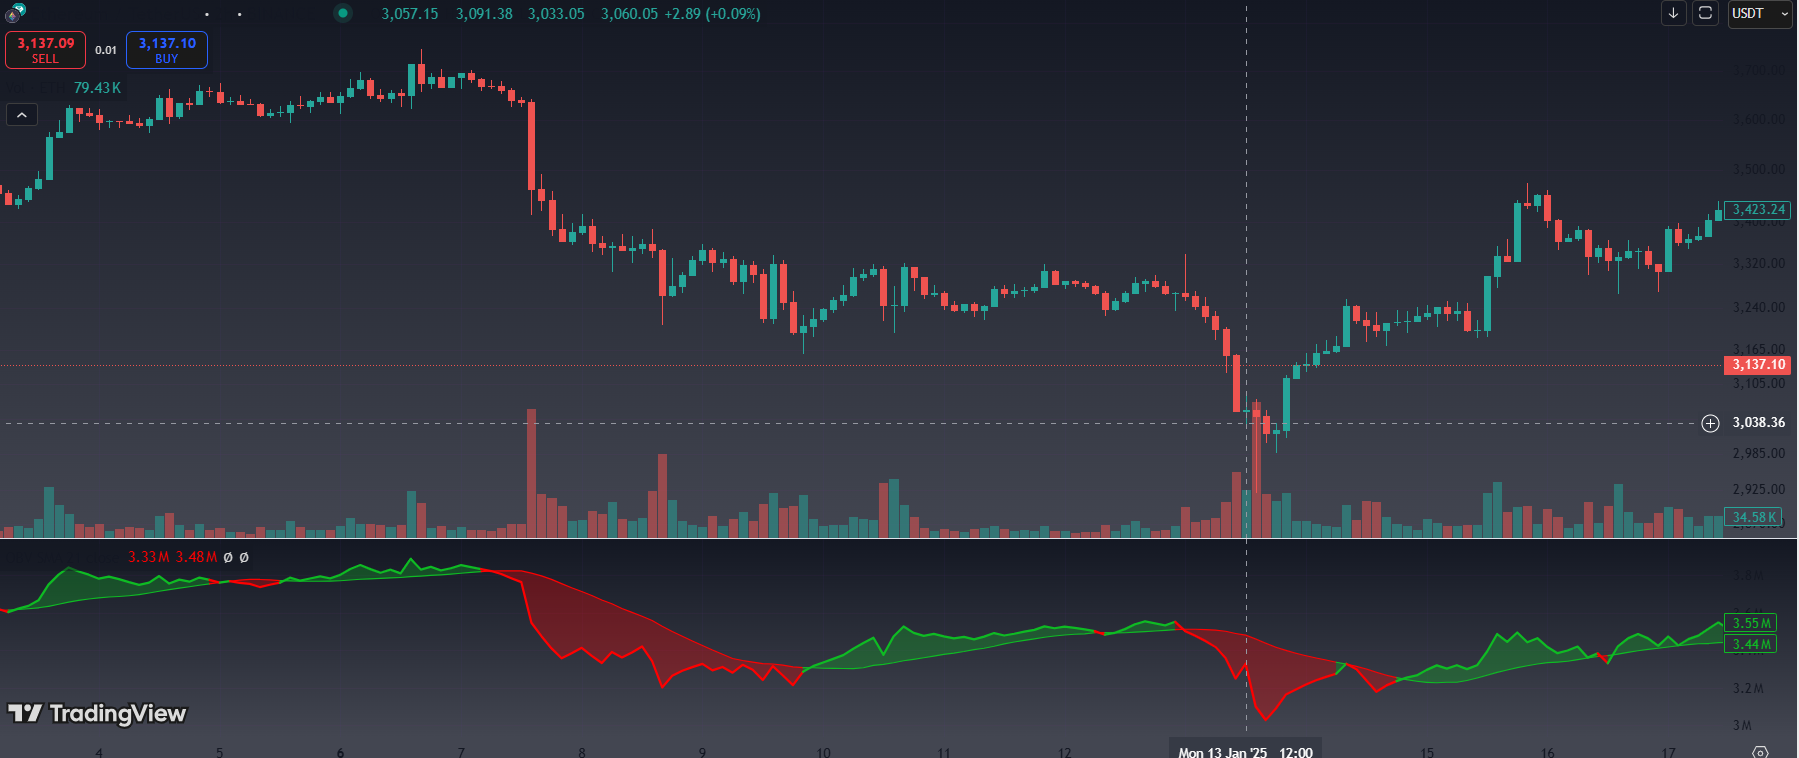
Why It’s Useful: OBV helps traders confirm trends. For example, if the price is moving up, but the OBV is falling, it might indicate a potential weakness in the uptrend, as the rally is not supported by strong buying volume. Conversely, if the price is moving up with an increasing OBV, the trend has solid support and is more likely to continue.
b. Volume Moving Average
What It Is: The Volume Moving Average (VMA) is a simple moving average (SMA) applied to volume data. It smooths out fluctuations in volume over a specific period to give traders a better understanding of volume trends without the noise of random spikes or drops.
How It Works:
- The VMA shows the average volume over a set period (e.g., 20 days). By comparing the current volume to this average, traders can determine whether volume is above or below normal.
- Above Average Volume: When the current volume exceeds the volume moving average, it suggests that market activity is higher than usual and may indicate an important event or trend development.
- Below Average Volume: When the current volume is below the moving average, it indicates low activity, suggesting that the market may be stagnant or that a price move is not well-supported.
Why It’s Useful: The Volume Moving Average helps traders identify significant changes in trading activity. When volume is consistently above the average, it might signal that the market is more active, and trends are likely to develop or continue. Conversely, volume below the average may indicate that a price move is weak and could reverse.
c. Chaikin Money Flow (CMF)
What It Is: The Chaikin Money Flow (CMF) indicator combines price and volume to measure the buying and selling pressure over a specific period. It is calculated by taking the accumulation or distribution of an asset over a given time frame and comparing it to the total volume for that period.
How It Works:
- The CMF produces a value that oscillates between positive and negative values. The value of the CMF is plotted as a line.
- Positive CMF: A positive value suggests buying pressure, meaning that more accumulation is happening than distribution. This is typically a bullish signal.
- Negative CMF: A negative CMF indicates selling pressure, with more distribution than accumulation, suggesting a bearish outlook.
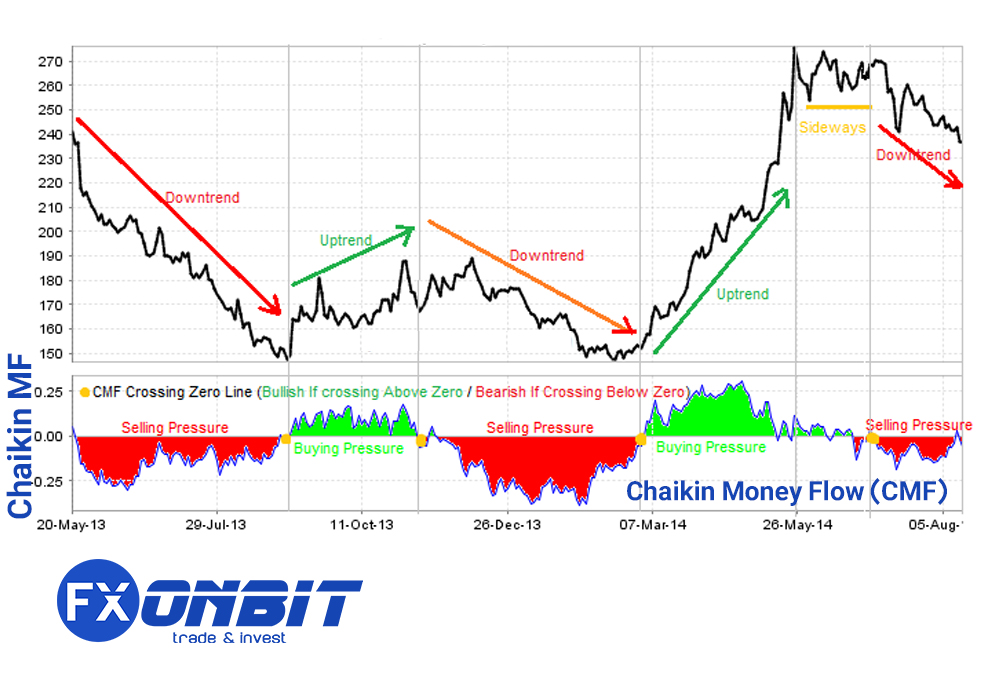
Why It’s Useful: The CMF is useful for detecting trend strength and momentum. When the CMF is positive and rising, it shows that there is strong buying pressure supporting the trend, while a negative CMF indicates a weakening trend with more selling pressure.
Example Usage:
- A positive CMF that rises above zero indicates that buyers are dominating, and the trend is likely to continue in the upward direction.
- A negative CMF that falls below zero signals that selling pressure is stronger, which might point to an upcoming price decline.
Read more: What is Crypto Whale Tracker? How FXonbit Empowers You to Follow Market Giants
Conclusion
Volume is a crucial aspect of trading that provides insight into the strength and legitimacy of price movements. Understanding how to interpret volume data can help traders identify market trends, spot potential reversals, and avoid fakeouts. Whether you’re trading stocks, forex, or cryptocurrency, volume analysis should be an essential part of your trading toolkit.
As a beginner, start by observing volume patterns and correlating them with price movements. Over time, this will help you develop a better understanding of market dynamics and improve your trading strategies.
Hi, I’m Asena, a Senior Marketing Specialist with over 8 years of experience and a deep passion for trading knowledge. I have a genuine fascination with the world of Crypto and Forex markets. Over the past 6 years, I’ve dedicated myself to writing about technical analysis, fundamental analysis, and the intricate dynamics of these markets. My mission is to provide the most complete and comprehensive data to empower my audience with actionable insights. I truly love what I do and constantly strive to deliver the best possible results for my readers and users.

Asena Taremi