30 Jan

A moving average (MA) is a key technical analysis tool used by traders in financial markets, such as forex, stocks, and cryptocurrencies. By smoothing price data, it helps traders identify trends, potential reversals, and support/resistance levels.
This article will provide a comprehensive understanding of moving averages, their types, applications, and strategies for using them effectively.
Find MA in Our Free Crypto & Forex Screener Dashboard
What is a Moving Average?
A moving average calculates the average price of a security over a specified time period, such as 10, 20, 30, or 50 periods. Moving average is a fully customizable indicator, meaning that trader can select any time frame they prefer when calculating the average. The most commonly used time frames for moving averages are 10, 20, 30, 50, 100, and 200 periods. The shorter the selected time frame, the more sensitive the moving average will be to recent price changes. Conversely, the longer the time frame, the less sensitive the moving average will be to recent price fluctuations.
Read more: Price Action Trading: The Art of Trading Without Indicators
Traders choose different time frames based on their trading goals. Typically, short-term moving averages are used for short-term trading, while longer-term moving averages are more suitable for long-term investments.
There is no specific framework or set of rules for adjusting moving averages. The best way to determine which settings work best for you is to experiment with different time periods until you find the one that aligns with your strategy. During this process, you’ll also become aware of the chart’s specific sensitivities to certain moving average values.
As new prices become available, the moving average “moves” by dropping the oldest price and including the most recent one. The primary purpose of a moving average is to reduce noise in the price data, allowing traders to focus on the underlying trend.
Explore more: MACD Divergence: A Comprehensive Guide for Traders
Moving averages are commonly used to identify the direction of price trends or to determine support and resistance levels. This indicator is considered a lagging or trend-following indicator because it is calculated based on past prices.
The longer the time frame of the moving average, the greater the lag in the curve’s movement. This means that recent price changes take longer to reflect on the chart. For example, a 200-day moving average will have a much greater lag compared to a 20-day moving average because it includes data from the past 200 days.
Read more: What is Crypto Whale Tracker? How FXonbit Empowers You to Follow Market Giants
Types of Moving Averages
There are several types of moving averages, but the most commonly used ones include:
1. Simple Moving Average (SMA) – The Foundation of Moving Averages
How It Works:
- The SMA calculates the average of the closing prices over a specified period (e.g., 10 days, 20 days, 50 days).
- Each price in the calculation has equal weight, so the average doesn’t give priority to recent prices.
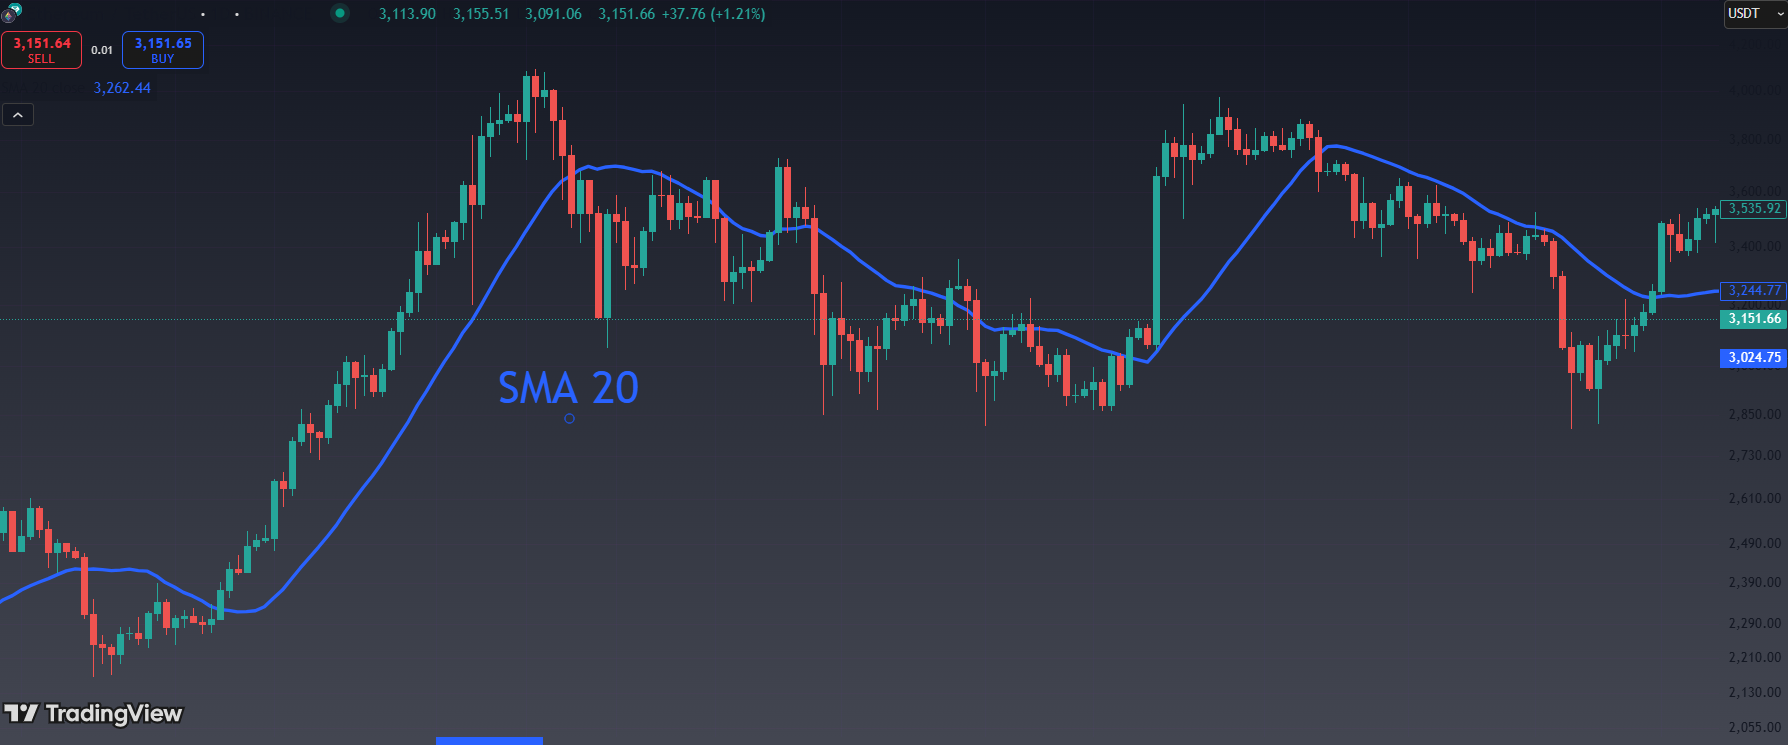
Why It’s Important:
- The SMA is one of the most basic tools for identifying long-term trends.
- It smooths out random price fluctuations and gives traders a clearer picture of the overall trend direction.
When to Use It:
- Long-term traders often use SMAs with longer periods (50-day, 100-day, 200-day) to spot broad market trends.
- It’s also useful as a support or resistance indicator. For example, the 200-day SMA is often watched as a key level.
Limitations:
- The SMA is slow to react to sudden price changes, making it less effective in fast-moving markets.
- It can lag behind current prices, meaning traders may miss early signals for reversals.
Example:
- If the price crosses above the 50-day SMA, it may signal a potential uptrend. If it crosses below, it could indicate a downtrend.
Read more: Advanced Ichimoku Cloud Trading Strategies
2. Exponential Moving Average (EMA) – Quick and Reactive
How It Works:
- The EMA applies a weighting factor to give more importance to recent prices.
- This means the most recent price movements have a stronger influence on the average compared to older data.
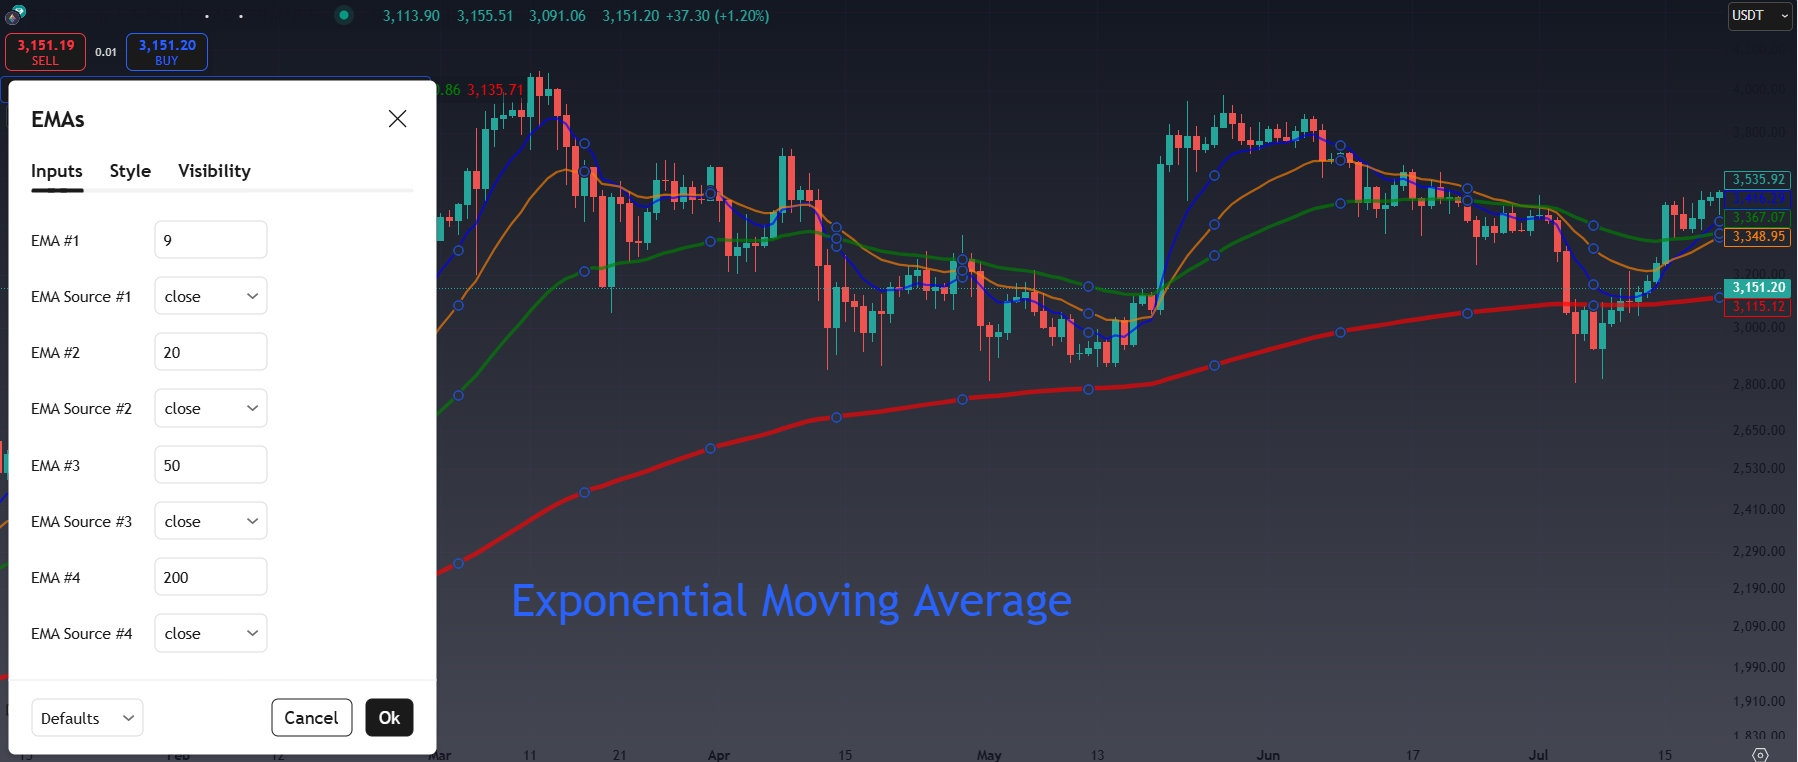
Why It’s Important:
- The EMA reacts faster to price changes, making it ideal for traders who want early signals.
- It is particularly useful in short-term trading where quick responses to market movements are crucial.
When to Use It:
- Day traders and swing traders often rely on shorter-period EMAs (e.g., 10-day or 20-day) to catch quick shifts in momentum.
- It can also be combined with longer-period EMAs or SMAs to create crossover strategies (e.g., a 9-day EMA crossing above a 21-day EMA).
Limitations:
- Because the EMA is highly sensitive, it can lead to more false signals in choppy or sideways markets.
Example:
- A common strategy is the “EMA Crossover,” where traders watch for a short-term EMA (e.g., 9-day) crossing above a long-term EMA (e.g., 21-day) as a buy signal.
Explore more: Top Indicators in Crypto Screeners for Effective Trading
3. Weighted Moving Average (WMA) – Balancing Reactivity and Stability
How It Works:
- The WMA assigns different weights to each price point, with the most recent prices receiving the highest weight.
- Unlike the EMA, where weighting is exponential, the WMA assigns fixed weights that gradually decrease over the selected period.
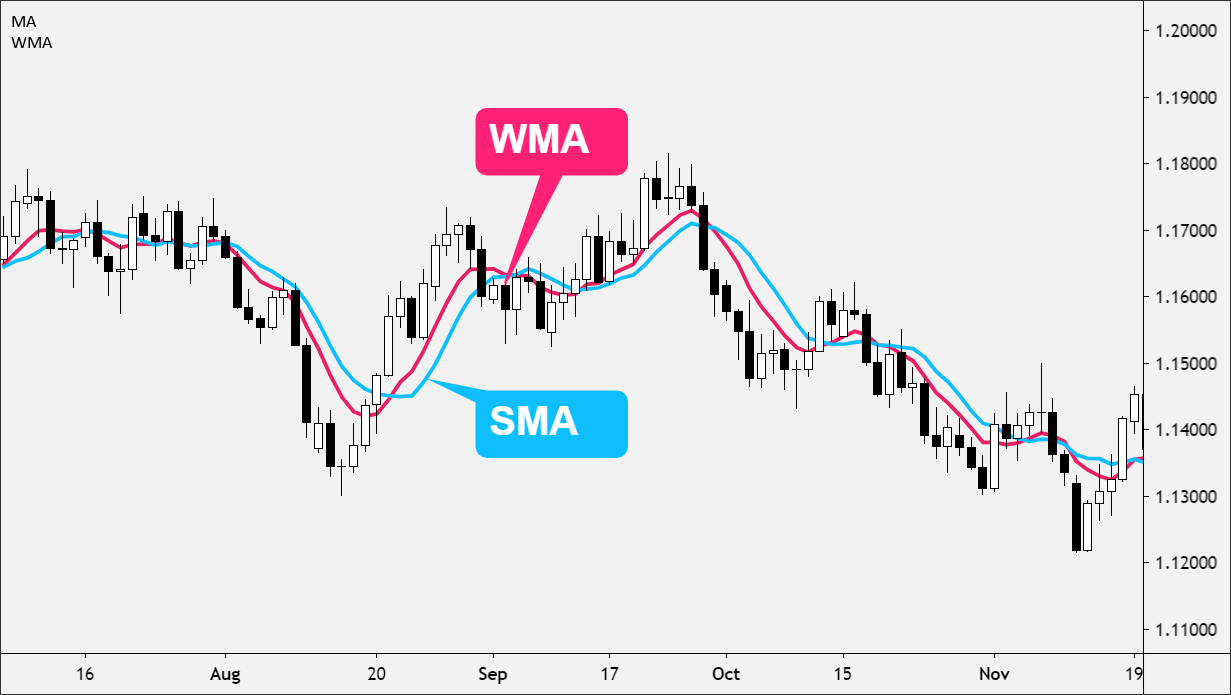
Why It’s Important:
- The WMA provides a middle ground between the slower SMA and the more reactive EMA.
- It helps traders track recent price movements while filtering out some of the noise.
When to Use It:
- The WMA is useful in markets where moderate volatility is common, such as tech stocks or crypto.
- Traders often use it to confirm signals from other indicators or as part of a moving average crossover strategy.
Limitations:
- While it is more responsive than the SMA, it can still lag compared to the EMA.
- It requires predefined weights, which may not always match current market conditions.
Example:
- A trader using a 10-period WMA may spot trends faster than someone using an SMA but avoid the excessive noise that an EMA might pick up in choppy markets.
Explore more: What is MACD? Full Guidance
4. Hull Moving Average (HMA) – Smooth Yet Fast-Reacting
How It Works:
- The Hull Moving Average is designed to reduce lag while maintaining smooth price movements.
- It achieves this by using a weighted average of multiple moving averages and applying a smoothing factor.
- The formula involves calculating the WMA of the price, reducing the lag using a square root of the period, and applying additional smoothing.
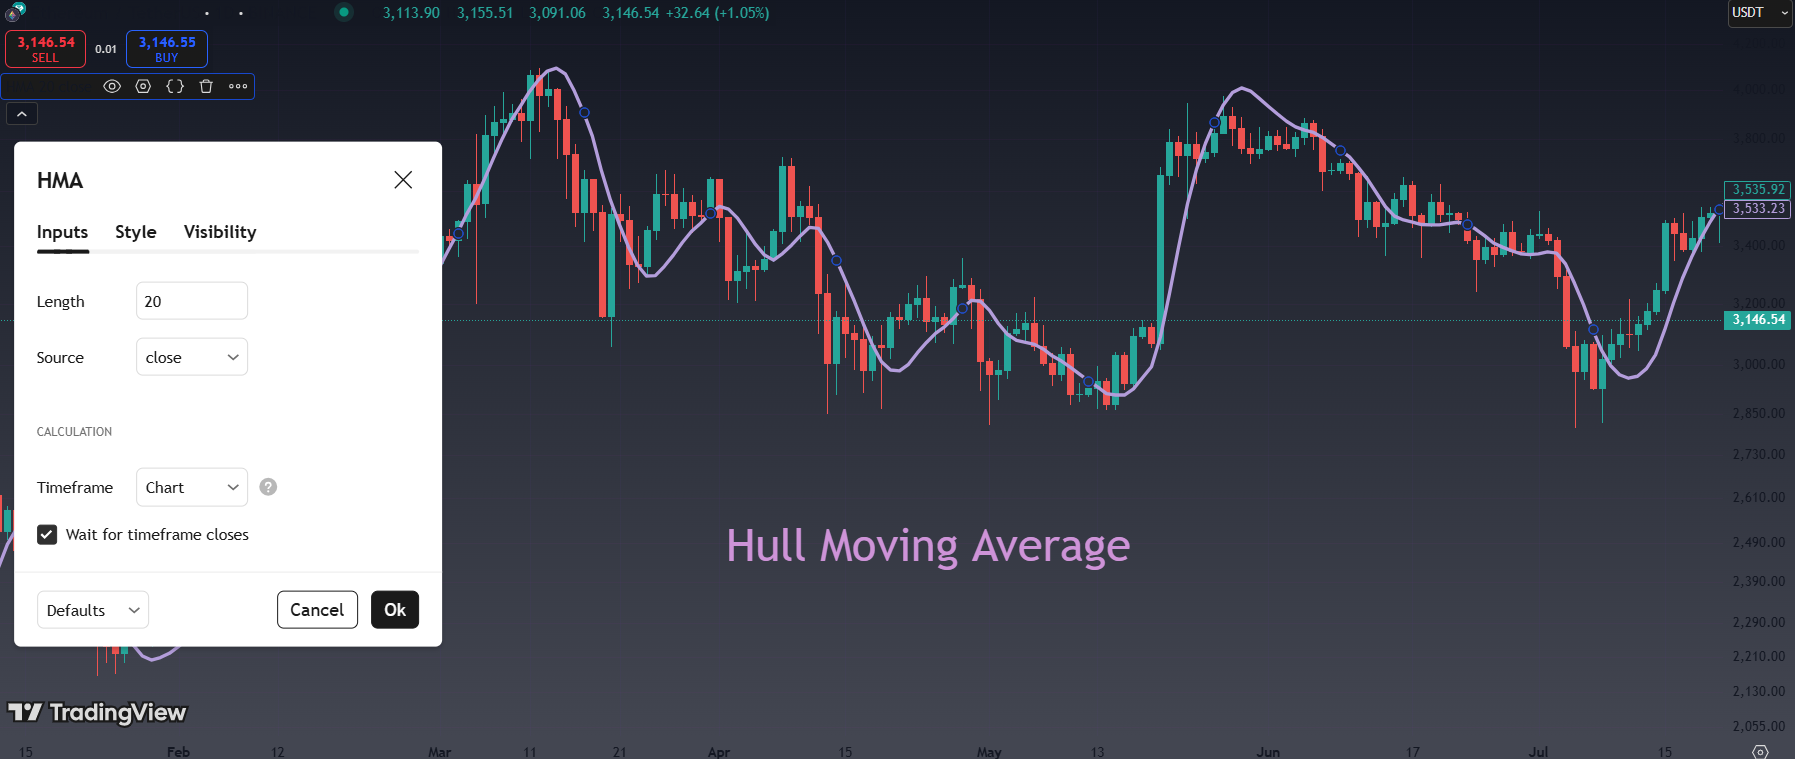
Why It’s Important:
- The HMA reacts quickly to changes in trend direction but remains smooth, avoiding the choppiness that can occur with other moving averages.
- It helps traders spot entry and exit points without getting confused by small fluctuations.
When to Use It:
- Traders who want to capture trends quickly but avoid noise use the HMA.
- It is particularly popular for trading fast-moving instruments like forex, cryptocurrencies, or high-volatility stocks.
Limitations:
- The calculation of the HMA is more complex compared to the SMA or EMA.
- It may require fine-tuning for different assets or timeframes to avoid overfitting.
Example:
- If the HMA turns upward after a sustained downward trend, it could signal a potential bullish reversal.
- Traders often use the HMA to confirm signals from other indicators like RSI or MACD.
Explore more: Understanding Volume in Trading: A Beginner’s Guide
Combining Moving Averages – Crossover Strategies:
1. What Are Moving Average Crossovers?
A moving average crossover happens when two different moving averages intersect on a price chart. Usually, traders combine a short-term moving average (e.g., 50-day) and a long-term moving average (e.g., 200-day). The relationship between these two helps traders identify buy and sell signals based on whether momentum is increasing or decreasing.
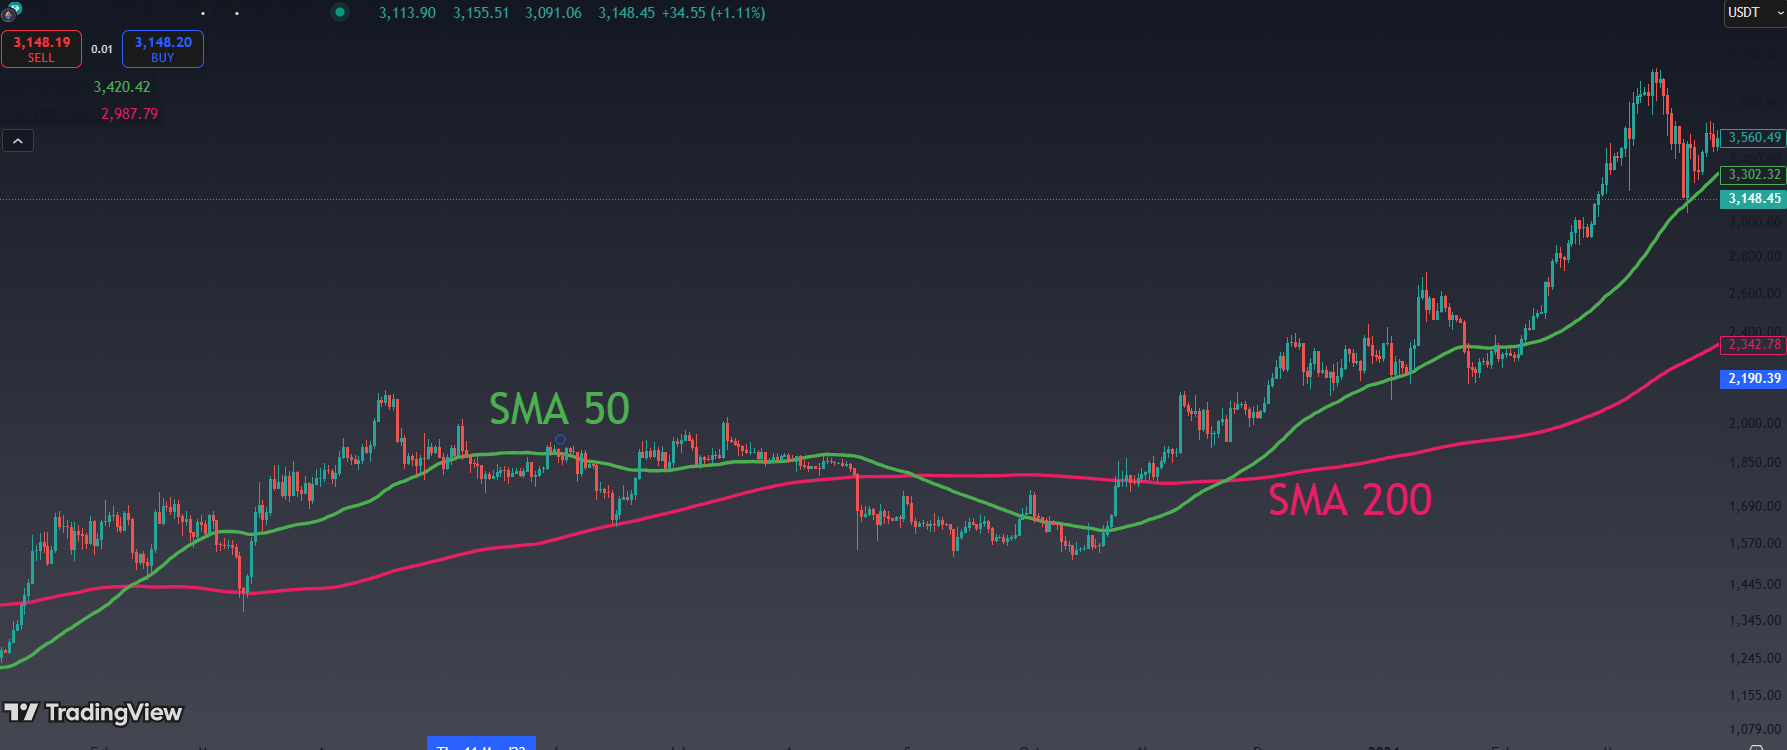
Think of moving averages like lines that represent trends:
- The short-term average reflects the recent momentum (the last few days or weeks).
- The long-term average represents the overall trend (months or longer).
When the short-term trend crosses the long-term trend, it signals a change in direction.
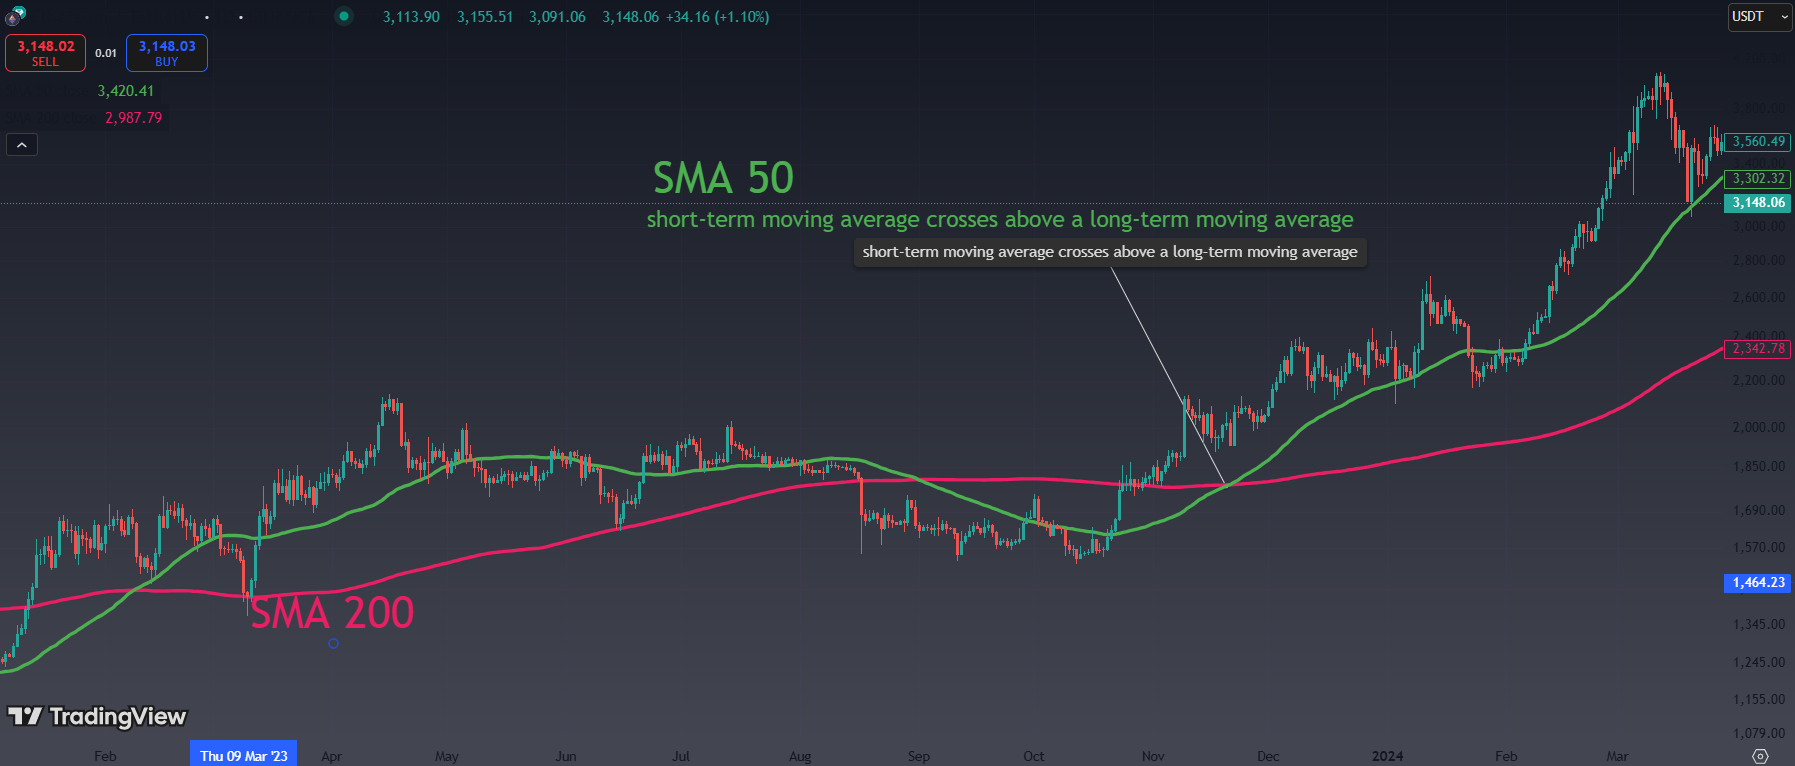
2. The Golden Cross – A Bullish Signal (Buy Signal)
Definition:
A Golden Cross occurs when a short-term moving average crosses above a long-term moving average.
It signals that the recent momentum is strong enough to potentially reverse a downtrend and start a new uptrend.
Explanation with Example:
Let’s say you are watching the 50-day moving average (short-term) and the 200-day moving average (long-term):
- If the 50-day MA crosses upward through the 200-day MA, traders see this as a bullish signal—an indicator that prices may continue rising.
- This often occurs after a prolonged downtrend, suggesting the market is recovering, and buyers are stepping in.
What It Means for Traders:
- Many traders enter buy positions when they see a Golden Cross because it’s considered a reliable sign that an uptrend is forming.
- Some may use it as a confirmation signal, waiting for additional indicators (like RSI or MACD) before entering.
Practical Example:
- Imagine a stock has been falling for months.
- Suddenly, prices start stabilizing, and the short-term (50-day MA) slowly climbs upward.
- When it crosses above the long-term (200-day MA), traders interpret this as the beginning of a new bullish trend and consider buying.
Read it: 40 Powerful Candlestick Patterns in Forex and Crypto Trading
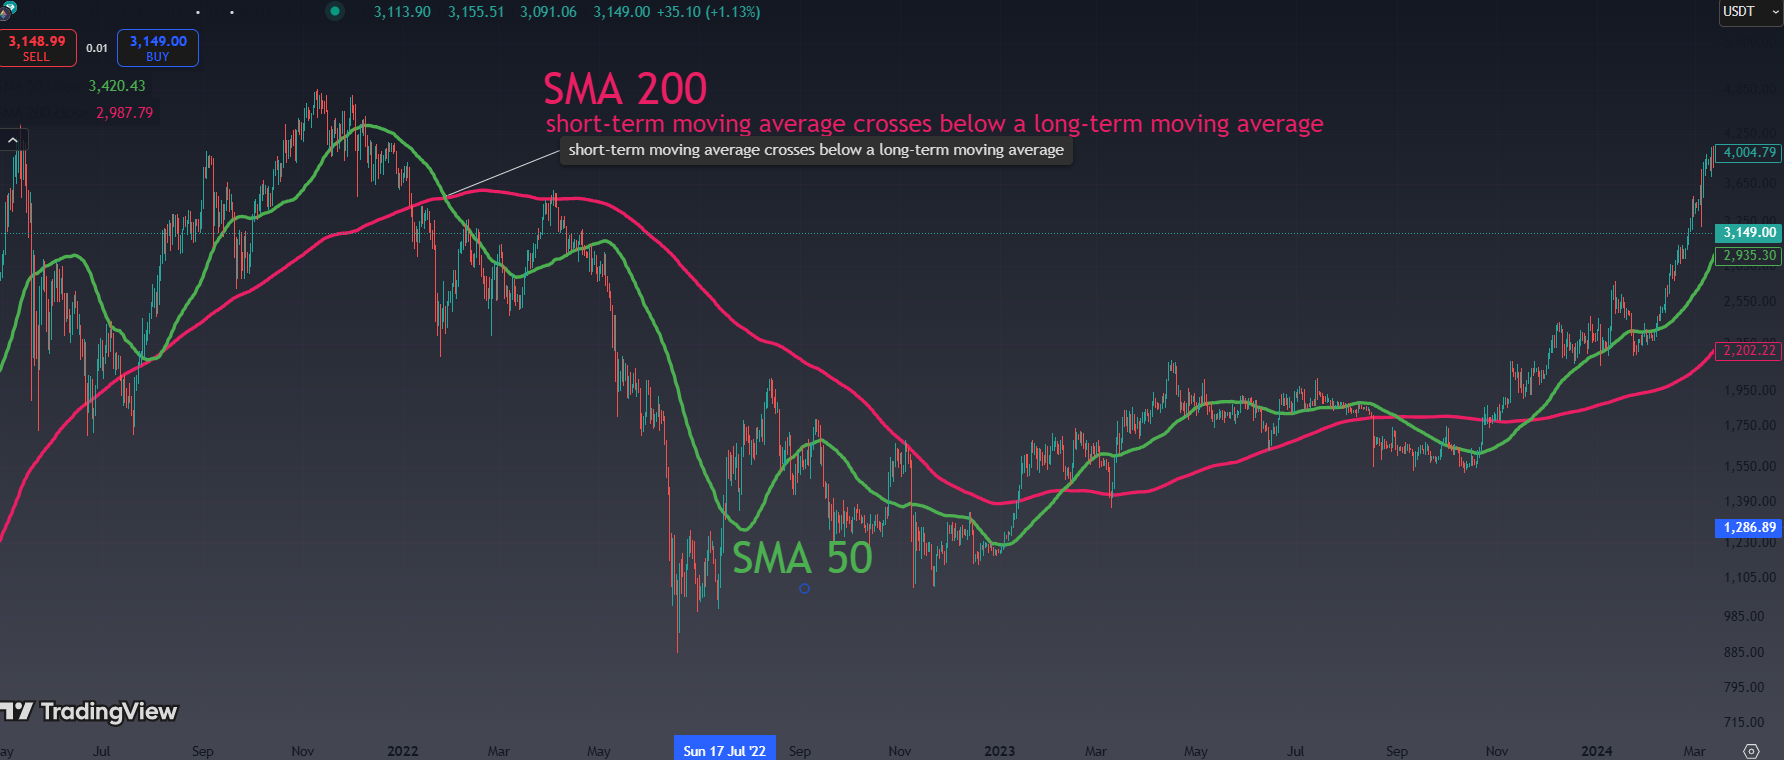
3. The Death Cross – A Bearish Signal (Sell Signal)
Definition:
A Death Cross happens when a short-term moving average crosses below a long-term moving average.
It signals that recent momentum is weakening, and the market may be entering a downtrend.
Explanation with Example:
Let’s stick to the 50-day MA and 200-day MA example:
- If the 50-day MA crosses downward through the 200-day MA, traders interpret this as a bearish signal, meaning prices could continue falling.
- This usually happens after an extended uptrend when momentum begins to fade.
What It Means for Traders:
- Many traders sell or short positions when they see a Death Cross, anticipating that the market will decline further.
- Some traders use this signal to exit existing long positions and protect profits.
Practical Example:
- Imagine a cryptocurrency has been in a strong uptrend for months.
- Suddenly, prices begin to dip, and the short-term (50-day MA) starts falling.
- When it crosses below the long-term (200-day MA), traders take this as a sign that the uptrend is over and selling pressure is building.
4. Visual Understanding of the Golden Cross and Death Cross:
- Picture a price chart where two lines are plotted:
- A short-term moving average (e.g., 50-day) in red
- A long-term moving average (e.g., 200-day) in blue
Here’s what you would see:
- Golden Cross: The red line (short-term) crosses upward through the blue line (long-term). This is a sign that buyers are gaining control.
- Death Cross: The red line (short-term) crosses downward through the blue line (long-term). This shows that sellers have the upper hand.
Explore more: On-Balance Volume (OBV): A Complete Guide for Traders
5. Example Trading Strategy with Golden Cross/Death Cross
Here’s a simple step-by-step approach to using these signals in trading:
Golden Cross (Buy Strategy):
- Watch for the short-term MA crossing above the long-term MA.
- Example: The 50-day moving average crosses above the 200-day moving average.
- Confirm the signal using other indicators:
- Check the Relative Strength Index (RSI): Is the market overbought or oversold?
- Look for increasing volume, which confirms strong buying interest.
- Enter a buy trade after confirmation.
- Set a stop-loss below a recent support level to limit risk.
- Exit the trade when the price shows signs of reversal or when a Death Cross forms.
Death Cross (Sell Strategy):
- Watch for the short-term MA crossing below the long-term MA.
- Example: The 50-day moving average crosses below the 200-day moving average.
- Confirm the signal using additional tools:
- Look at MACD (Moving Average Convergence Divergence) to see if bearish momentum is increasing.
- Check volume: Is selling pressure building?
- Enter a sell trade or close long positions once confirmed.
- Set a stop-loss above a recent resistance level.
- Exit the trade when the trend shows signs of bottoming out or a Golden Cross occurs.
6. Important Tips for Traders:
- Timeframe matters: The Golden Cross and Death Cross work best on longer timeframes (daily charts or higher). Using them on shorter timeframes (like 5-minute charts) may produce false signals.
- Use confirmations: Don’t rely solely on these crossovers. Confirm with other indicators like RSI, MACD, or volume to increase the reliability of your trades.
- Avoid choppy markets: In sideways or highly volatile markets, these signals can be misleading. Make sure there is a clear trend before acting.
Summary Table:
| Signal | Trigger | Interpretation | Action |
|---|---|---|---|
| Golden Cross | Short-term MA crosses above long-term MA | Bullish signal – potential uptrend | Enter a buy trade or hold long |
| Death Cross | Short-term MA crosses below long-term MA | Bearish signal – potential downtrend | Enter a sell trade or short |
In Summary:
- Golden Cross signals that buyers are stepping in and the market is ready to trend upward.
- Death Cross warns that sellers are dominating and a potential downtrend is starting.
Read more: FXonbit CandleStick Pattern Finder Service: Your Gateway to Smarter Forex and Crypto Trading

How to Choose the Right Moving Average:
a. Simple Moving Average (SMA) – Long-Term Trend Identification
The SMA is best for long-term traders who want to avoid reacting to short-term noise.
Why Use It:
- The SMA smooths out price movements by taking the average of prices over a long period.
- It’s slower to react to price changes, which makes it ideal for spotting overall market direction rather than short-term fluctuations.
When to Use:
- If you’re a position trader or an investor holding trades for weeks or months, the SMA can help you stay focused on the bigger picture.
- Commonly used periods: 50-day, 100-day, or 200-day SMA.
Example:
- A 200-day SMA is often used to identify whether a market is generally bullish (if the price is above the SMA) or bearish (if the price is below the SMA).
- You would ignore short-term price volatility and follow the major trend.
b. Exponential Moving Average (EMA) – Fast Signals for Short-Term Trading
The EMA is perfect for short-term traders who want faster signals and quick reactions to price changes.
Why Use It:
- The EMA gives more weight to recent prices, making it more responsive to current price action.
- It helps day traders, scalpers, and swing traders react quickly to market changes and spot entries/exits before they miss opportunities.
When to Use:
- If you’re trading volatile markets like forex, crypto, or high-beta stocks, the EMA helps you stay ahead of sudden price movements.
- Commonly used periods: 9-day, 12-day, or 20-day EMA.
- Often used in combination with longer EMAs for crossover strategies (e.g., a 9-day EMA crossing a 21-day EMA is a common buy signal).
Example:
- If you’re day trading Bitcoin, you might use a 9-day EMA to capture intraday trends and avoid lagging signals from slower averages like the SMA.
Explore more: Analyzing Volume Patterns for Breakout & Reversal Signals
c. Weighted Moving Average (WMA) – Balanced Between Reactivity and Stability
The WMA offers a balance for traders who want recent price sensitivity but less noise than the EMA.
Why Use It:
- The WMA assigns predefined weights to recent prices, so it reacts faster than the SMA but doesn’t jump at every minor price fluctuation like the EMA.
- It’s useful for identifying moderate trends without getting caught in false signals.
When to Use:
- If you’re a swing trader or short-term investor looking to hold trades for a few days or weeks, the WMA can provide solid signals without being overly sensitive.
- Commonly used periods: 10-day or 20-day WMA.
Example:
- When trading tech stocks or crypto, the WMA can help you spot potential reversals or trend continuations without getting shaken by small intraday moves.
d. Hull Moving Average (HMA) – Minimizing Lag with Smooth Signals
The HMA is great for traders who want a smooth, fast-moving average that reduces lag and avoids choppiness.
Why Use It:
- The HMA is designed to be faster than the SMA and EMA while staying smooth.
- It’s ideal for detecting trend changes early without getting confused by small price fluctuations.
When to Use:
- If you’re a trend-following trader or trading high-volatility markets where quick decisions matter, the HMA can give you timely yet reliable signals.
- Commonly used periods: 14-day or 20-day HMA.
Example:
- In forex or crypto markets, where quick reversals happen often, the HMA helps reduce the risk of false signals while providing a more reliable trend indicator.
Summary Table – When to Use Each Moving Average
| Type | Best For | Why Choose It? | Common Periods |
|---|---|---|---|
| SMA | Long-term traders | Simple and stable, filters out short-term noise | 50-day, 100-day, 200-day |
| EMA | Short-term traders (day, swing) | Reacts quickly to price changes, ideal for volatile markets | 9-day, 12-day, 20-day |
| WMA | Swing traders | Balanced reactivity, less noise than EMA | 10-day, 20-day |
| HMA | Trend followers, fast markets | Reduces lag, smooth and fast signals | 14-day, 20-day |
Choosing Based on Your Trading Style
- Long-term investing: Use the SMA to stay focused on the major trend and avoid reacting to small fluctuations.
- Day trading or swing trading: Use the EMA for quick signals or the WMA if you prefer more balance.
- High-volatility markets (like crypto): The HMA can help you stay on top of rapid changes without falling for fake-outs.
Explore more: What is Crypto Screener? The Best Crypto Screener

How to Use Moving Averages in Trading
1. Identifying Trends
Moving averages help traders identify the direction of the market:
- Uptrend: Price consistently stays above the moving average.
- Downtrend: Price stays below the moving average.
For example:
- A 50-period SMA or EMA is commonly used to determine the long-term trend.
2. Support and Resistance Levels
Moving averages can act as dynamic support and resistance levels. When prices approach a moving average, traders often watch for potential bounces or breaks.
- Support: Price rebounds from a moving average during an uptrend.
- Resistance: Price is rejected by a moving average during a downtrend.
3. Crossover Strategies
Crossover strategies involve using two moving averages of different lengths to generate buy or sell signals.
- Bullish Crossover (Golden Cross): When a short-term MA (e.g., 50-period) crosses above a long-term MA (e.g., 200-period), it signals a potential upward trend.
- Bearish Crossover (Death Cross): When a short-term MA crosses below a long-term MA, it signals a potential downward trend.
Popular Moving Average Trading Strategies
1. The Golden Cross and Death Cross Strategy
- Golden Cross: A buy signal when the 50-period MA crosses above the 200-period MA.
- Death Cross: A sell signal when the 50-period MA crosses below the 200-period MA.
This strategy is often used by long-term traders to capture major market movements.
2. Moving Average Bounce Strategy
This strategy involves trading the bounce off of a key moving average during strong trends. For example, traders may buy when the price bounces off the 50-day EMA during an uptrend.
Steps:
- Identify the trend using a long-term moving average.
- Enter when the price bounces off the moving average.
- Set stop losses below the moving average for protection.
3. EMA Scalping Strategy
Scalpers often use short-term EMAs (e.g., 5-period and 10-period) on smaller timeframes to identify quick entry and exit points.
Steps:
- Use 5-period and 10-period EMAs.
- Buy when the 5-period EMA crosses above the 10-period EMA.
- Sell when the 5-period EMA crosses below the 10-period EMA.
- Manage risk with tight stop losses.
Read more: Crypto Scalp Trading: Basic Guide
Moving Average Period Selection
The period of a moving average determines how many data points (typically days or candlesticks) are included in the calculation. Shorter periods react faster to price changes, while longer periods smooth out fluctuations and focus on broader trends. Here’s how to select the right period based on your trading style:
a. Short-Term Traders (Day Traders, Scalpers)
- Typical Moving Average Periods: 5, 10, or 20 periods (e.g., 5-day, 10-day, or 20-day)
- Purpose: Quickly react to price changes and capture short-term momentum.
- Why: These periods are highly sensitive and can help you spot intraday or short-term opportunities for fast entries and exits.
Read more: What is Scalp Trading and How to Use Algo Trading for Scalping
Example of Use:
- A day trader using a 10-period EMA on a 5-minute chart can quickly identify whether the trend is up or down and enter trades accordingly.
- The 5-period SMA or EMA is useful in scalping strategies where quick price movements are crucial.
Best Markets:
- Forex, crypto, or high-volatility stocks are perfect for short-term traders since these markets often move quickly.
Caution:
- Short periods can generate false signals in choppy markets, so always use additional indicators (like RSI or MACD) to confirm entries and exits.
Explore more: How to Use Volume to Confirm Market Trends and Read Market Sentiment
b. Swing Traders (Medium-Term)
- Typical Moving Average Periods: 50, 100 periods (e.g., 50-day or 100-day)
- Purpose: Track medium-term price movements and capture trends over days or weeks.
- Why: These periods help swing traders ride trends for longer periods while avoiding noise from short-term fluctuations.
Example of Use:
- A 50-day SMA can help a swing trader identify a sustained uptrend or downtrend in a stock.
- If the price crosses above the 50-day SMA, it could signal an entry for a long position. Conversely, if the price drops below, it could indicate a short or exit.
Best Markets:
- Stocks, commodities, and ETFs, where trends typically unfold over several days or weeks.
Caution:
- The 50 or 100 periods may be too slow for fast-moving markets like crypto or forex, so adjust accordingly based on volatility.
c. Long-Term Investors (Position Traders, Investors)
- Typical Moving Average Periods: 200 periods (e.g., 200-day moving average)
- Purpose: Identify the overall direction of the market and make decisions based on major trends.
- Why: The 200-day moving average is a common benchmark used by long-term traders and institutions to determine whether an asset is bullish or bearish.
Example of Use:
- If a stock’s price is consistently trading above the 200-day SMA, long-term investors often consider the market bullish and maintain long positions.
- If it breaks below the 200-day SMA, it could signal a potential bear market or sell-off.
Best Markets:
- Stocks, index funds, or long-term holdings like gold and other commodities.
Caution:
- The 200-period moving average lags behind price action, so it may miss short-term reversals or opportunities.
Combining Moving Average Periods:
Traders often combine multiple periods for a clearer view of market conditions:
- Short-term (10-period) + Medium-term (50-period): Helps day or swing traders spot entry and exit points when the shorter average crosses the longer one.
- Medium-term (50-period) + Long-term (200-period): Used to confirm large market movements and avoid false signals.
- Golden Cross and Death Cross strategies are based on this combination (e.g., 50-day MA crossing the 200-day MA).
Summary Table – Selecting the Right Period
| Trading Style | Common Periods | Purpose | Best Market Type |
|---|---|---|---|
| Short-Term Traders | 5, 10, or 20 periods | Capture quick momentum and intraday trends | Forex, crypto, high-volatility stocks |
| Swing Traders | 50 or 100 periods | Ride medium-term trends over several days/weeks | Stocks, ETFs, commodities |
| Long-Term Investors | 200 periods | Identify major, long-term market movements | Stocks, index funds, gold, and bonds |
In Summary:
- Experiment with different periods: Depending on the asset and timeframe, you may need to adjust the moving average period for optimal results.
- Combine periods: Use short, medium, and long-term moving averages together for better trend confirmation and fewer false signals.
- Test on historical data: Before trading live, backtest your moving average settings on past price data to understand how they perform in various market conditions.
Advantages of Using Moving Averages
- Trend Identification: Helps traders quickly identify the market direction.
- Simplicity: Easy to understand and apply.
- Customization: Can be adapted to different timeframes and strategies.
- Versatility: Works across multiple asset classes, including stocks, forex, and crypto.
Limitations of Moving Averages
- Lag: Moving averages are lagging indicators, meaning they respond to price changes after they have occurred.
- Whipsaws: In choppy or ranging markets, moving averages can generate false signals.
- Limited Predictive Power: They are better suited for confirmation rather than prediction.
To mitigate these limitations, traders often combine moving averages with other indicators, such as the Relative Strength Index (RSI) or MACD.
Moving Average Convergence Divergence (MACD)
The MACD (Moving Average Convergence Divergence) is a popular technical indicator used by traders to identify trend direction, momentum, and potential buy/sell signals. It is closely related to moving averages because it measures the difference between two exponential moving averages (EMAs) and generates signals when those averages converge or diverge.
Let’s break down its components and how to use them effectively in trading:
1. Components of the MACD
The MACD consists of three main parts:
a) MACD Line:
- The MACD line is the difference between the 12-period EMA and the 26-period EMA.
- Formula:
MACD Line=12-period EMA − 26-period EMA - Purpose: This line tells you whether short-term momentum is stronger or weaker than the longer-term trend.
How to interpret it:
- When the MACD Line is above zero, it indicates that the 12-period EMA is greater than the 26-period EMA, suggesting bullish momentum.
- When it is below zero, it shows that the 26-period EMA is greater, signaling bearish momentum.
b) Signal Line:
- The Signal Line is a 9-period EMA of the MACD Line.
- Purpose: The Signal Line helps smooth out the MACD and is used to generate buy or sell signals through crossovers.
How to interpret it:
- When the MACD Line crosses above the Signal Line, it’s a bullish signal (buy signal).
- When the MACD Line crosses below the Signal Line, it’s a bearish signal (sell signal).
c) Histogram:
- The Histogram represents the difference between the MACD Line and the Signal Line.
- It is displayed as vertical bars that fluctuate above and below a zero line.
How to interpret it:
- When the Histogram is above zero and increasing, it indicates growing bullish momentum.
- When it is below zero and decreasing, it suggests increasing bearish momentum.
- The larger the bars, the stronger the momentum, while shrinking bars indicate weakening momentum.
2. MACD Trading Signals
Here are some key ways traders use the MACD:
a) MACD Crossover Signals
- Bullish Crossover (Buy Signal):
When the MACD Line crosses above the Signal Line, it indicates that short-term momentum is accelerating, and traders may consider entering a buy position. - Bearish Crossover (Sell Signal):
When the MACD Line crosses below the Signal Line, it suggests that bearish momentum is increasing, and traders may consider entering a sell position.
Example:
- If the MACD Line crosses above the Signal Line while the Histogram is growing, this is a strong indication to buy.
- Conversely, if the MACD Line crosses below and the Histogram turns negative, it’s a potential sell signal.
b) Zero Line Crossover
- The zero line represents the point where the MACD Line equals zero, meaning the 12-period EMA and 26-period EMA are equal.
How to interpret it:
- When the MACD Line crosses above zero, it’s a bullish signal, indicating a potential uptrend.
- When the MACD Line crosses below zero, it’s a bearish signal, indicating a potential downtrend.
Example:
- If the MACD Line crosses above the zero line after a bullish crossover, it confirms that the market is shifting upward.
c) Divergence Signals
Divergences occur when the MACD and price are moving in opposite directions, indicating a possible trend reversal.
- Bullish Divergence:
When the price is making lower lows, but the MACD is making higher lows, it could signal that the downtrend is losing strength and a reversal to the upside is possible. - Bearish Divergence:
When the price is making higher highs, but the MACD is making lower highs, it indicates that the uptrend is weakening and a possible reversal to the downside could occur.
Example:
- In a bearish divergence, traders may look to sell when the MACD crosses below the Signal Line to confirm the reversal.
Explore more: Resistance Breakout (Breakout) in Technical Analysis
3. How to Use the MACD in Your Trading Strategy
Here’s a step-by-step guide on how you can effectively incorporate the MACD into your trading:
- Identify the Trend:
- Use the MACD Line’s position relative to the zero line to determine the trend direction (above zero for bullish, below zero for bearish).
- Look for Crossover Signals:
- Watch for the MACD Line to cross the Signal Line as a potential entry or exit signal.
- Confirm with the direction of the Histogram to ensure momentum is increasing.
- Confirm with Other Indicators:
- Combine the MACD with other indicators like RSI (to identify overbought/oversold conditions) or moving averages to improve accuracy.
- Set Stop Losses:
- Place stop-loss orders to manage risk in case the signal is false.
4. Example MACD Strategy
MACD + Moving Average Strategy:
- Combine the MACD with a moving average to trade trends and reversals.
Steps:
- Apply a 50-day SMA on the chart to identify the overall trend.
- Use the MACD crossovers to time entries and exits.
- Enter a buy position when the MACD Line crosses above the Signal Line and both are above the zero line.
- Exit when the MACD Line crosses below the Signal Line.
- Reverse for short positions.
Summary Table – MACD Interpretation
| Component | How to Interpret | Signal Type |
|---|---|---|
| MACD Line | Difference between 12-period EMA and 26-period EMA | Trend direction and momentum |
| Signal Line | 9-period EMA of the MACD Line | Crossovers provide buy/sell signals |
| Histogram | Difference between MACD Line and Signal Line | Shows momentum strength or weakness |
| Bullish Crossover | MACD Line crosses above Signal Line | Buy signal |
| Bearish Crossover | MACD Line crosses below Signal Line | Sell signal |
| Zero Line Crossover | MACD Line crosses zero (up or down) | Confirms trend changes |
| Divergence | Price moves opposite to MACD direction | Potential trend reversal signal |
Practical Example: Using Moving Averages on a Chart
Let’s assume you are analyzing the EUR/USD forex pair using a 50-day EMA and a 200-day EMA.
- Golden Cross: The 50-day EMA crosses above the 200-day EMA, signaling a potential long trade.
- Confirmation: Check for confluence with other indicators like RSI to confirm the trend.
- Entry and Exit: Enter the trade and use the moving averages as dynamic stop-loss levels.
Conclusion
Moving averages are essential tools for traders of all experience levels. Whether you are a day trader or a long-term investor, understanding how to use moving averages effectively can improve your trading decisions. By combining them with other indicators and strategies, you can reduce false signals and enhance your overall market analysis.
Key Takeaway: No single indicator guarantees success in trading. Always practice proper risk management and backtest your moving average strategies before applying them in live markets.
Hi, I’m Asena, a Senior Marketing Specialist with over 8 years of experience and a deep passion for trading knowledge. I have a genuine fascination with the world of Crypto and Forex markets. Over the past 6 years, I’ve dedicated myself to writing about technical analysis, fundamental analysis, and the intricate dynamics of these markets. My mission is to provide the most complete and comprehensive data to empower my audience with actionable insights. I truly love what I do and constantly strive to deliver the best possible results for my readers and users.

Asena Taremi