11 Feb

When it comes to technical analysis, the Moving Average Convergence Divergence (MACD) indicator stands as one of the most popular and versatile tools used by traders across forex, crypto, stocks, and other markets. This guide will walk you through everything you need to know about setting up and interpreting the MACD, ensuring you can make effective market entries and exits with confidence.
Start Our Crypto & Forex Dashboard For Free
What is the MACD Indicator?
The MACD (Moving Average Convergence Divergence) is one of the most widely used technical indicators in trading. It is both a momentum and trend-following tool designed to reveal the strength, direction, and duration of a price trend in markets like forex, stocks, and cryptocurrencies.
Developed by Gerald Appel in the late 1970s, the MACD has stood the test of time due to its simplicity and effectiveness in spotting buy and sell opportunities. By combining moving averages and momentum analysis, it helps traders not only detect trend changes but also gauge the potential speed of price movement.
Explore more: How to Combine Technical Indicators for More Accurate Trade Signals
The indicator does this by analyzing the difference between two Exponential Moving Averages (EMAs)—typically the 12-period and 26-period EMAs. These EMAs place more weight on recent price data, making MACD reactive to market changes while filtering out short-term fluctuations.
Traders and investors rely on the MACD to identify signals such as:
- Trend Reversals: When momentum shifts from bullish to bearish or vice versa.
- Trend Strength: By analyzing how far apart the EMAs diverge or converge.
- Entry and Exit Points: Signals are generated based on crossovers between the MACD line and the signal line, or when the histogram crosses the zero line.
The MACD is highly versatile and can be used across different timeframes, making it suitable for day traders, swing traders, and long-term investors.
Explore more: Risk Management in Trading: A Complete Guide for Traders

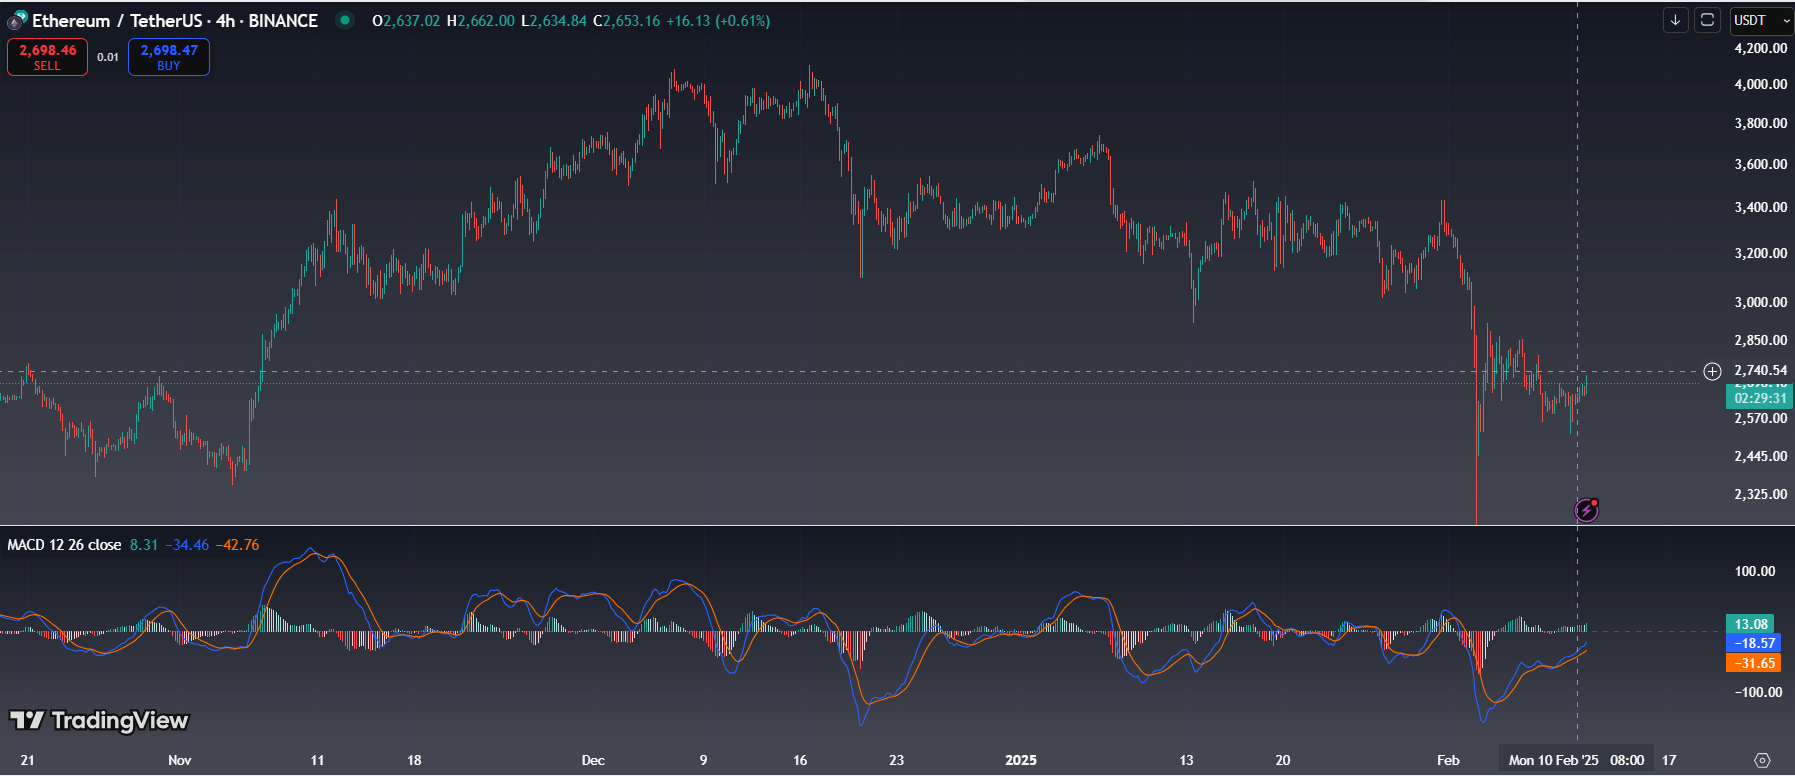
The MACD consists of three key components:
- MACD Line: The difference between the 12-period Exponential Moving Average (EMA) and the 26-period EMA.
- Signal Line: A 9-period EMA of the MACD line.
- Histogram: The difference between the MACD line and the signal line, displayed as bars above or below a zero line.
Explore more: Simple Moving Average (SMA)
Setting Up the MACD
The MACD indicator is readily available on most trading platforms, making it easy for traders to incorporate it into their analysis. Here’s a step-by-step guide to help you set it up efficiently:
- Open the Chart:
- Start by selecting the asset you want to analyze (e.g., forex pairs, stocks, cryptocurrencies) and open its price chart on your preferred platform, such as TradingView or MetaTrader.
- Find the Indicator Menu:
- Look for the section labeled “Indicators” on your platform.
- This is typically accessible through a toolbar at the top or side of the chart interface.
- Search for the MACD Indicator:
- Type “MACD” into the search bar of the indicator menu.
- Once found, select and apply it to the active chart.
- Set the Default Parameters:
- Most trading platforms use the default settings of (12, 26, 9):
- 12-period EMA: Shorter, faster-moving average.
- 26-period EMA: Longer, slower-moving average.
- 9-period EMA: The signal line used for generating buy/sell signals.
- Most trading platforms use the default settings of (12, 26, 9):
- Optional Adjustment of Settings:
- The default settings work well in many markets, especially for daily timeframes.
- However, you can customize the periods to suit different timeframes or specific asset volatility. For example:
- Shorter timeframes: (6, 13, 5) for faster signals
- Longer timeframes: (19, 39, 9) for smoothing noise
Once set up, the MACD will display below your price chart, ready to provide you with trend and momentum signals.
Read more: Best Crypto Screener for Trading
Read more: Exponential Moving Average (EMA): A Comprehensive Guide for Traders
How to Interpret the MACD
The MACD indicator provides multiple signals to help traders make informed decisions. Understanding these signals can improve timing for entries and exits. Below are the key methods of interpretation:
1. MACD Line Crossovers
The crossover between the MACD line and the signal line is one of the most common and effective signals:
- Bullish Crossover:
- Occurs when the MACD line crosses above the signal line.
- It suggests that upward momentum is increasing, potentially indicating a buying opportunity.
- This signal is stronger when it occurs below the zero line and during a market uptrend.
- Bearish Crossover:
- Occurs when the MACD line crosses below the signal line.
- It signals that downward momentum is gaining strength, suggesting a selling opportunity.
- The signal is stronger when it occurs above the zero line and during a market downtrend.

2. Histogram Analysis
The MACD histogram visually represents the difference between the MACD line and the signal line:
- Positive Histogram:
- Bars appear above the zero line, indicating bullish momentum.
- As long as the bars remain positive, the trend may continue upward.
- Negative Histogram:
- Bars appear below the zero line, signaling bearish momentum.
- This can indicate sustained selling pressure.
- Expanding Bars:
- When the histogram bars grow larger (either above or below the zero line), it suggests increasing trend strength.
- A strong uptrend or downtrend may be underway.
- Contracting Bars:
- When the bars begin to shrink, it signals weakening momentum.
- This could be a sign of potential consolidation or a reversal.
3. Zero Line Cross
The zero line represents the point where the 12-period EMA and the 26-period EMA are equal:
- Crossing Above the Zero Line:
- When the MACD line crosses above the zero line, it signals that the 12-period EMA has surpassed the 26-period EMA, indicating upward momentum.
- This is generally considered bullish and often confirms a long position.
- Crossing Below the Zero Line:
- When the MACD line crosses below the zero line, it indicates that the 12-period EMA is below the 26-period EMA, signaling downward momentum.
- Traders often use this as confirmation for short positions or to exit long trades.

Read this: The Best Martingale Strategy for Trading
Using the MACD for Market Entries and Exits
The MACD indicator can be highly effective when used as part of an entry and exit strategy in trading. Combining its signals with proper risk management can help traders maximize profits and minimize losses.
1. Entry Strategies:
- Bullish Crossover:
- Enter a long (buy) position when the MACD line crosses above the signal line, particularly if this happens when the MACD line is also moving above the zero line.
- The zero line cross provides additional confirmation that upward momentum is strengthening.
- Example: For stocks or forex, if the MACD crossover aligns with an upward trend in the price, it signals a good entry point.
- Divergence Confirmation:
- Look for bullish divergences, where the price forms lower lows, but the MACD forms higher lows.
- This divergence suggests that the downward momentum is weakening and a price reversal upward could occur soon.
- Divergences are particularly effective when confirmed by other technical indicators or support levels.
2. Exit Strategies:
- Bearish Crossover:
- Exit a long position when the MACD line crosses below the signal line.
- This crossover indicates weakening upward momentum and potential downside risk.
- Overbought Signals:
- If the MACD histogram becomes significantly extended (very large positive bars), it may indicate the market is overbought and due for a correction.
- Exiting a position during such conditions can help lock in profits before a possible price retracement.
- This signal is stronger when confirmed by overbought readings on other indicators, like the Relative Strength Index (RSI).
3. Stop-Loss and Take-Profit Management:
- Stop-Loss:
- Place stop-loss orders to protect your capital.
- In a long trade, set the stop just below the nearest support level or recent swing low.
- In a short trade, place the stop above the nearest resistance level.
- Take-Profit:
- Set take-profit targets based on historical resistance levels, Fibonacci retracements, or key psychological price levels.
- Use the MACD’s crossover or histogram contraction as a signal to take partial or full profits.
- Trailing Stops:
- A trailing stop can be used when momentum is strong. For instance, as long as the MACD histogram is expanding or the MACD line is above the signal line, keep adjusting the stop to lock in profits.
For higher accuracy, traders often combine the MACD with other indicators like RSI, Bollinger Bands, or support and resistance zones to filter false signals and enhance decision-making.
Read more: Advanced Ichimoku Cloud Trading Strategies

Explore more: MACD Divergence: A Comprehensive Guide for Traders
Divergence: An Advanced MACD Technique
Divergence is an advanced MACD concept that helps traders detect potential trend reversals by analyzing the difference in behavior between price action and the MACD indicator. When the two move in opposite directions, it often signals that the current trend is weakening and could reverse.
Explore more: Advanced Technical Analysis: Using Divergences and Convergences for Precision Trading
Types of Divergences:
1. Bullish Divergence
- Definition: A bullish divergence occurs when the price forms lower lows, but the MACD forms higher lows.
- What It Means: This suggests that the selling pressure is diminishing even though prices are declining, which can be a sign of an impending upward price reversal.
- When to Act:
- Look for confirmation from a MACD crossover or a break of key resistance levels to enter a buy position.
- It’s particularly strong when the divergence forms near oversold conditions or long-term support zones.
Example:
- Price forms lower lows on the chart, but the MACD line or histogram creates higher lows. This could indicate that bears are losing strength and bulls are gaining control.
Read more: Weighted Moving Average (WMA): A Comprehensive Guide for Traders
2. Bearish Divergence
- Definition: A bearish divergence occurs when the price forms higher highs, but the MACD forms lower highs.
- What It Means: This indicates that even though the price is rising, the upward momentum is fading, suggesting a possible downward reversal.
- When to Act:
- Look for confirmation from a bearish MACD crossover or a breakdown of key support levels to enter a sell position.
- The signal is stronger if the divergence occurs near overbought conditions or a major resistance zone.
Example:
- Price continues to rise, forming new highs, but the MACD peaks at lower highs. This could indicate that buyers are losing momentum, and sellers may take over soon.
Explore more: Top Indicators in Crypto Screeners for Effective Trading
Tips for Trading Divergences:
- Multiple Timeframe Analysis: Divergences on higher timeframes (e.g., 1D or 4H) are more reliable compared to shorter timeframes.
- Combine with Other Indicators: For better confirmation, combine divergence signals with indicators like RSI, Stochastic Oscillator, or Fibonacci retracements.
- Wait for Confirmation: Always wait for an additional signal (e.g., a MACD crossover or price pattern breakout) to avoid false reversals.
Divergence, when used correctly, can be a powerful early warning tool for major market shifts. However, it should not be used in isolation—combining it with broader market analysis and other technical tools will improve accuracy.
Explore more: Understanding Volume in Trading: A Beginner’s Guide
Common MACD Mistakes to Avoid
- Ignoring Larger Trends: Always consider the broader market context. The MACD can generate false signals in choppy or sideways markets.
- Over-Reliance on Crossovers: Don’t rely solely on MACD crossovers—combine them with other indicators like RSI, support/resistance, or volume analysis.
- Neglecting Risk Management: Always set stop-loss and take-profit levels to protect your capital.
Explore more: What is Crypto Screener? The Best Crypto Screener
Combining MACD with Other Indicators
To improve the reliability of MACD signals and reduce the likelihood of false breakouts or reversals, traders often combine it with complementary indicators. These additional tools provide different perspectives on market conditions, enhancing overall trading accuracy.
1. Relative Strength Index (RSI)
- Purpose: Identify whether an asset is in an overbought or oversold condition.
- How It Works with MACD:
- If the MACD generates a bullish crossover and the RSI indicates oversold conditions (typically below 30), it strengthens the buy signal.
- If the MACD produces a bearish crossover and the RSI is in overbought territory (above 70), it provides stronger confirmation for a potential sell-off.
- Why Combine: RSI gives insight into market momentum extremes, while MACD tracks trend reversals, creating a powerful combination to anticipate significant price movements.
Read more: Mastering Range Trading: A Complete Guide for Crypto Traders
2. Bollinger Bands
- Purpose: Provide a dynamic range around the price that adjusts with volatility, helping traders identify potential reversals or breakouts.
- How It Works with MACD:
- A MACD bullish crossover combined with the price touching or breaking below the lower Bollinger Band may signal a potential reversal to the upside.
- A MACD bearish crossover with the price hitting or surpassing the upper Bollinger Band could indicate a potential downside reversal.
- Why Combine: Bollinger Bands help visualize volatility, giving traders better context when MACD signals occur, especially during periods of high price movement.
Explore more: Overcoming FOMO: The Fear of Missing Out
3. Volume Indicators (e.g., On-Balance Volume, Volume Oscillator)
- Purpose: Confirm whether the market has enough participation to sustain a trend or breakout.
- How It Works with MACD:
- A MACD crossover accompanied by increasing volume strengthens the signal, indicating that the price movement is backed by genuine buying or selling pressure.
- Conversely, a MACD crossover with low or decreasing volume could be a warning of a false signal or temporary price movement.
- Why Combine: Since volume is considered a leading indicator, it helps confirm whether the market momentum suggested by the MACD is reliable.
Explore more: Filtering High-Volume Cryptos: Guide to Finding Liquidity with Screeners
Combining Example Strategy:
- Step 1: Look for a MACD bullish crossover.
- Step 2: Check if the RSI is oversold (below 30).
- Step 3: Verify if the price is near the lower Bollinger Band or if volume is increasing.
- Step 4: Enter a buy trade with a stop-loss below the recent swing low.
By combining MACD with these indicators, traders gain a well-rounded view of market dynamics, which can lead to more confident and profitable trading decisions.
Read more: What is Crypto Whale Tracker? How FXonbit Empowers You to Follow Market Giants
MACD for Different Trading Styles
The flexibility of the MACD indicator allows it to be used across different trading styles. By adjusting the MACD settings and combining it with specific timeframes, traders can tailor its use for scalping, swing trading, or day trading.
1. Scalping: Fast, Short-Term Trades
- Goal: Quickly capture small price movements within minutes.
- MACD Settings: (5, 13, 6) — These shorter periods make the MACD more responsive to rapid price changes.
- Timeframes: 1-minute to 5-minute charts for fast-moving markets.
- Strategy:
- Look for quick MACD crossovers for entry and exit signals.
- Confirm trades with momentum indicators (like RSI) or volume.
- Since the goal is fast execution, traders often close positions as soon as they achieve small profits or detect weakening momentum.
Read more: Crypto Scalp Trading: Basic Guide
2. Swing Trading: Medium-Term Trades
- Goal: Capture price swings over a few days to weeks.
- MACD Settings: Default (12, 26, 9) or slightly modified, depending on market conditions.
- Timeframes: 4-hour to daily charts for identifying broader trend movements.
- Strategy:
- Look for MACD crossovers near key support or resistance levels to signal entry points.
- Bullish divergence: A great entry signal when combined with oversold RSI conditions.
- Hold trades for a few days or weeks and exit when the MACD crosses back or shows weakening momentum (e.g., contracting histogram).
3. Day Trading: Intraday Trades
- Goal: Profit from intraday trends within a single trading session.
- MACD Settings: Stick to the default (12, 26, 9) but adjust if necessary for high volatility.
- Timeframes: 5-minute, 15-minute, or 30-minute charts for intraday analysis.
- Strategy:
- Enter trades based on MACD crossovers, but confirm them with price action (e.g., breakouts or candlestick patterns).
- Monitor volume indicators to ensure strong participation.
- Zero line crosses are critical for confirming major intraday trend shifts.
- Traders should exit trades by the end of the session to avoid overnight risks.
Key Takeaway:
- Scalping: Fast settings for quick entries and exits.
- Swing Trading: Default settings for capturing medium-term trend shifts.
- Day Trading: Combine default settings with short timeframes for precise intraday decisions.
By understanding the nature of each trading style and optimizing the MACD settings accordingly, traders can enhance their success across different market conditions.
Explore more: Crypto Grid Trading Strategy Ultimate Guide for Profitable Market Trading
Conclusion: Mastering the MACD
The MACD indicator is a powerful tool that, when used correctly, can help traders identify market trends, determine entry and exit points, and confirm potential reversals. However, no indicator is perfect. To maximize its effectiveness, combine it with other forms of analysis and always use proper risk management techniques.
Whether you’re a beginner or a seasoned trader, understanding and mastering the MACD can significantly enhance your trading performance. Practice using it on demo accounts before applying it to live trades, and remember that continuous learning is key to success in any financial market.
Read more: FXonbit CandleStick Pattern Finder Service: Your Gateway to Smarter Forex and Crypto Trading
Hi, I’m Asena, a Senior Marketing Specialist with over 8 years of experience and a deep passion for trading knowledge. I have a genuine fascination with the world of Crypto and Forex markets. Over the past 6 years, I’ve dedicated myself to writing about technical analysis, fundamental analysis, and the intricate dynamics of these markets. My mission is to provide the most complete and comprehensive data to empower my audience with actionable insights. I truly love what I do and constantly strive to deliver the best possible results for my readers and users.

Asena Taremi