01 Feb

Moving averages are essential tools in the technical analysis toolkit of traders. Among the many types of moving averages, the Weighted Moving Average (WMA) stands out due to its ability to emphasize recent price data, making it highly responsive to market movements. This guide covers everything traders need to understand and effectively use WMA.
What is a Weighted Moving Average (WMA)?
The Weighted Moving Average is a type of moving average that assigns greater weight to more recent data points while giving less importance to older data points. This characteristic makes WMA more sensitive to price changes than the simple moving average (SMA), providing traders with quicker signals for potential price reversals or trend continuations.
Formula for WMA
The general formula for a WMA is:
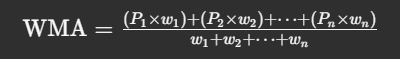
Where:
- P represents the price at a specific time.
- w denotes the weight assigned to each price.
- n is the number of periods considered.
For example, in a 5-period WMA, the most recent price might be multiplied by 5, the second most recent by 4, and so on until the oldest price is multiplied by 1.
Read more: Exponential Moving Average (EMA): A Comprehensive Guide for Traders

Explore more: How to Combine Technical Indicators for More Accurate Trade Signals
Why Use the Weighted Moving Average (WMA) in Trading?
WMA is a valuable tool for traders due to its ability to provide fast, reliable signals while filtering out unnecessary market noise. Here’s a breakdown of the key reasons to use WMA in trading:
1. Capture Recent Price Trends
- Explanation: The WMA places more weight on recent prices, making it highly responsive to new information. Compared to the Simple Moving Average (SMA), the WMA reacts faster to price changes, which is critical in fast-moving markets.
- Why It’s Useful:
- Traders can detect shifts in market conditions, such as reversals or breakouts, more quickly than they would with other moving averages.
- Early trend identification allows for timely entries and exits.
- Example:
- If prices are experiencing a sudden breakout, the WMA will adjust faster, helping traders catch the trend early before it’s fully priced in.
2. Filter Out Noise
- Explanation: Markets often experience minor price fluctuations or “noise” that don’t reflect genuine trend changes. The WMA smooths out these fluctuations while retaining the integrity of major trends.
- Why It’s Useful:
- Traders can avoid reacting to false signals and focus on significant price movements.
- This reduces overtrading and increases the reliability of signals.
- Example:
- During a consolidation phase, where prices move within a narrow range, the WMA helps traders avoid entering trades based on insignificant price movements.
3. Generate Trading Signals
- Explanation: WMA is commonly used to generate actionable trading signals through crossovers, convergence/divergence, and interactions with price.
- How It Works:
- Crossover Signals: When a short-term WMA crosses a long-term WMA, it can signal a buy (bullish crossover) or sell (bearish crossover) opportunity.
- Convergence/Divergence: The distance between two WMAs can indicate the strength of a trend or an impending reversal.
- Price Interactions: When prices bounce off or break through the WMA, it can act as dynamic support or resistance.
- Example:
- A trader may use a 10-period WMA and a 50-period WMA. When the 10-period WMA crosses above the 50-period, it’s a bullish signal. Conversely, when it crosses below, it’s a bearish signal.
Read this: The Best Martingale Strategy for Trading
Additional Benefits of Using WMA:
- Combines Well with Other Indicators: WMA works efficiently with oscillators like the RSI or MACD for confirming signals.
- Customization Options: Traders can customize the WMA period and weighting to fit their specific trading strategy (short-term or long-term).
Read more: Advanced Ichimoku Cloud Trading Strategies
How to Calculate the WMA
Step-by-Step Example:
Let’s say you want to calculate a 5-period WMA using the following price data:
| Day | Price ($) | Weight |
|---|---|---|
| 1 | 50 | 1 |
| 2 | 51 | 2 |
| 3 | 52 | 3 |
| 4 | 53 | 4 |
| 5 | 54 | 5 |
- Multiply each price by its corresponding weight:
- 50 × 1 = 50
- 51 × 2 = 102
- 52 × 3 = 156
- 53 × 4 = 212
- 54 × 5 = 270
- Sum the weighted prices:
- 50 + 102 + 156 + 212 + 270 = 790
- Sum the weights:
- 1 + 2 + 3 + 4 + 5 = 15
- Calculate the WMA:
- WMA = 790 / 15 = 52.67
Thus, the 5-period WMA is 52.67.
Explore more: Top Indicators in Crypto Screeners for Effective Trading
How to Use WMA in Trading
1. Trend Identification
WMA is a great tool for identifying the market’s direction because it reacts more quickly to price changes than the Simple Moving Average (SMA) due to the heavier weight on recent prices.
- Bullish Trend:
- When the WMA is sloping upward and prices consistently remain above the WMA, it suggests strong buying momentum.
- Traders interpret this as a signal of a possible uptrend continuation, where higher highs and higher lows may be expected.
- Entry Strategy: Look for buy setups as long as prices stay above the WMA, especially when the slope of the WMA is steepening.
- Bearish Trend:
- When the WMA slopes downward and prices stay below it, the market may be in a downtrend, with lower highs and lower lows developing.
- Entry Strategy: Look for sell setups as long as prices remain below the WMA, and confirm if the WMA is steepening downward.
Explore more: Understanding Volume in Trading: A Beginner’s Guide
2. WMA Crossovers
Crossovers between different WMAs of varying periods are widely used by traders to generate entry and exit signals. The idea is to capture the momentum shift as one moving average crosses another.
- Bullish Signal (Golden Cross):
- When a short-term WMA (e.g., 10-period) crosses above a long-term WMA (e.g., 50-period), it signals that recent prices are rising faster than the longer-term trend.
- This crossover often indicates the beginning of an uptrend, making it a buy signal.
- Confirmation Tip: Look for additional signs like increasing trading volume or positive divergence on an oscillator (e.g., RSI).
- Bearish Signal (Death Cross):
- When a short-term WMA crosses below a long-term WMA, it indicates a potential downtrend as recent prices decline faster than the longer-term trend.
- Traders see this as a sell signal, especially if confirmed by weakening market sentiment or high selling pressure.
Read more: Mastering the Martingale Trading Strategy
3. Dynamic Support and Resistance
The WMA doesn’t just show the direction of the trend but can act as a dynamic support or resistance level, adapting to changing prices in real time.
- During an Uptrend (Dynamic Support):
- When prices are trending higher, the WMA often acts as a support level. Traders watch for price pullbacks to the WMA, which may signal buying opportunities.
- Strategy: Enter a long trade when prices bounce off the WMA with strong bullish candlestick formations (e.g., engulfing candles or pin bars).
- During a Downtrend (Dynamic Resistance):
- In a downtrend, prices may approach the WMA but fail to break above it, using the WMA as resistance.
- Strategy: Enter a short trade when prices bounce down from the WMA with bearish candlestick patterns (e.g., bearish engulfing or shooting star).
Read more: Price Action Trading: The Art of Trading Without Indicators
4. Combining WMA with Other Indicators
To increase the probability of successful trades, it’s useful to combine WMA signals with other indicators that provide additional confirmation.
- Relative Strength Index (RSI):
- Purpose: Identify overbought (above 70) or oversold (below 30) conditions.
- How to Combine:
- In a bullish WMA crossover, check if the RSI is exiting oversold territory, which can strengthen the buy signal.
- In a bearish WMA crossover, see if the RSI is leaving overbought territory for added confidence in the sell signal.
- Moving Average Convergence Divergence (MACD):
- Purpose: Confirm trend direction and momentum shifts.
- How to Combine:
- If the MACD line crosses above the signal line during a WMA bullish crossover, it confirms a buy signal.
- If the MACD crosses below the signal line during a WMA bearish crossover, it strengthens a sell signal.
- Bollinger Bands:
- Purpose: Measure volatility and identify potential reversal zones.
- How to Combine:
- When prices touch or move outside the lower Bollinger Band and the WMA provides a bullish crossover, it may indicate an upward reversal.
- Similarly, if prices break above the upper Bollinger Band and the WMA shows a bearish crossover, a downward reversal is likely.
Explore more: What is Free Crypto Screener? The Best Crypto Screener
Example Trading Setup Using WMA with Confirmation
- Step 1: Use a 10-period WMA and a 50-period WMA to identify potential crossovers.
- Step 2: Check the RSI to see if the asset is overbought or oversold.
- Step 3: Use Bollinger Bands to confirm if prices are at an extreme (either the upper or lower band).
- Step 4: If all conditions align, execute the trade and manage it using trailing stops or risk management rules.
By integrating these strategies, WMA can serve as a powerful tool for traders to identify trends, generate trade signals, and increase the likelihood of profitable trades.
Explore more: MACD Divergence: A Comprehensive Guide for Traders
Read more: What is Crypto Whale Tracker? How FXonbit Empowers You to Follow Market Giants
Advantages of Weighted Moving Average (WMA)
- Faster Reaction to Price Changes:
- Explanation: Unlike the Simple Moving Average (SMA), which assigns equal weight to all past prices, WMA places greater emphasis on the most recent prices. This allows it to react faster to price changes, making it highly useful for identifying quick market shifts.
- Benefit: Traders can spot reversals and breakouts earlier, gaining a potential edge in fast-moving markets.
- Improved Sensitivity:
- Explanation: The WMA’s sensitivity to recent price action makes it particularly valuable for short-term traders, such as day traders or scalpers, who need to act on early signs of trend development or reversals.
- Benefit: It helps in generating timely entry and exit signals, reducing the likelihood of missing key market moves.
- Example: A short-term trader can use a 10-period WMA to detect intraday opportunities while minimizing lag compared to other moving averages.
Explore more: Symmetrical Triangle Pattern: A Powerful Price Action Signal
- Customizable:
- Explanation: WMA is highly adaptable because traders can select the time period (e.g., 5, 10, or 50 periods) and adjust the weighting factor to emphasize recent price action more or less.
- Benefit: This flexibility allows traders to tailor the WMA to suit their trading style—whether they prefer short-term, medium-term, or long-term strategies.
- Example: A swing trader might use a 50-period WMA for medium-term trend identification, while a scalper may opt for a 5-period WMA for quick signals.
- Reduced Lag Compared to SMA:
- Explanation: Since WMA gives more weight to current prices, it produces signals with less lag than SMA, helping traders make faster decisions when markets move.
- Benefit: In rapidly fluctuating markets, this can help traders exit positions before reversals occur, potentially reducing losses and locking in profits.
- Effective for Crossovers:
- Explanation: The WMA can be effectively paired with other moving averages of different periods to create crossover strategies, where traders use the intersection of two WMAs to confirm buy or sell signals.
- Benefit: This makes it a powerful tool for both trend-following and reversal-based strategies.
Overall, WMA offers a combination of speed, flexibility, and precision, making it an excellent choice for traders seeking timely and reliable trading signals.
Read more: FXonbit CandleStick Pattern Finder Service: Your Gateway to Smarter Forex and Crypto Trading

Disadvantages of WMA
- Increased Sensitivity to Noise: The fast reaction of WMA can sometimes generate false signals, especially in choppy markets.
- Lagging Nature: Although less lagging than SMA, WMA is still a lagging indicator that relies on past price data.
- Optimization Risk: Over-optimizing the WMA period can lead to curve-fitting, making the strategy less effective in real-time trading.
Practical Trading Example
Scenario: Using a 10-period and 50-period WMA on a stock chart.
- Identify a Cross: The 10-period WMA crosses above the 50-period WMA, signaling a potential uptrend.
- Confirm the Trend: Use additional indicators (e.g., RSI above 50) to confirm bullish momentum.
- Place a Trade: Enter a long position once the crossover is confirmed.
- Set Stop Loss: Place a stop loss below the recent swing low to limit risk.
- Monitor the Trade: If the 10-period WMA crosses back below the 50-period WMA, consider exiting the position.
Explore more: Volume Analysis for Day Traders: How to Maximize Profits
Customizing WMA for Different Markets
Traders across various markets—forex, stocks, and cryptocurrencies—can fine-tune the Weighted Moving Average (WMA) to suit their trading environments and strategies. Here’s how WMA customization varies by market:
1. Forex Traders: Short-Term WMAs for Quick Market Moves
- Why Shorter Periods?
- The forex market is known for high liquidity and frequent price fluctuations, making short-term trends valuable for day traders and scalpers. Shorter WMAs (e.g., 5-period, 10-period) help traders react quickly to price movements and capitalize on intraday volatility.
- Suggested Setup:
- Primary WMA Periods: 5-period WMA and 10-period WMA for quick signals.
- Trading Strategy: Look for short-term WMA crossovers and price bounces off the WMA in trending markets.
- Tip: Combine the WMA with momentum indicators like the Relative Strength Index (RSI) to confirm if the short-term trend is sustainable.
Read more: Crypto Scalp Trading: Basic Guide
2. Stock Traders: Medium-Term WMAs for Capturing Intermediate Trends
- Why Medium-Term Periods?
- Stock markets generally exhibit slower and more stable trends compared to forex, especially for swing and position traders. Medium-term WMAs (e.g., 20-period, 50-period) are useful for identifying intermediate price trends and retracement opportunities.
- Suggested Setup:
- Primary WMA Periods: 20-period WMA and 50-period WMA for swing trading and trend-following strategies.
- Trading Strategy:
- Bullish Signal: When prices consistently stay above the 20-period WMA, traders can ride the upward trend.
- Bearish Signal: If prices drop below the 50-period WMA, it may indicate a downtrend or trend reversal.
- Tip: Use WMAs alongside volume indicators to validate breakouts and confirm the strength of price movements.
3. Crypto Traders: WMAs Combined with Volatility-Based Indicators
- Why Combine WMAs with Volatility Indicators?
- The cryptocurrency market is known for extreme price volatility, where sudden price spikes or crashes can distort traditional trend signals. By combining WMAs with volatility indicators, traders can better filter false signals and identify strong trends.
- Suggested Setup:
- Primary WMA Periods: 10-period WMA and 30-period WMA for trend identification.
- Volatility Indicator: Bollinger Bands (to assess volatility and detect potential reversals).
- Trading Strategy:
- When prices break above or below the Bollinger Bands, look for confirmation from WMA crossovers before entering a trade.
- If prices revert back to the WMA after touching the bands, it may indicate a continuation of the trend.
- Tip: Consider using the Average True Range (ATR) to set dynamic stop-loss levels when trading crypto due to frequent price swings.
Summary of Custom WMA Settings by Market:
| Market | Primary WMA Periods | Complementary Indicators | Trading Style |
|---|---|---|---|
| Forex | 5-period, 10-period | RSI, MACD | Day trading, scalping |
| Stocks | 20-period, 50-period | Volume, MACD | Swing trading, position trading |
| Crypto | 10-period, 30-period | Bollinger Bands, ATR | Trend-following, volatility-based |
Common Mistakes to Avoid
- Ignoring Market Context: WMA signals work best when combined with market context and other indicators.
- Overtrading: Due to its sensitivity, WMA can generate frequent signals, but not all are worth trading.
- Neglecting Risk Management: Always use stop losses and proper position sizing to mitigate losses.
Conclusion
The Weighted Moving Average is a powerful tool for traders seeking to capture trends, spot reversals, and gain an edge in the market. Its ability to emphasize recent price data makes it ideal for short- and medium-term trading strategies. However, like any indicator, it works best when combined with a comprehensive trading plan that includes other tools, market context, and proper risk management. By mastering the WMA, traders can significantly improve their ability to make informed decisions in dynamic markets.
Start experimenting with different WMA periods, backtest your strategies, and refine your approach to find what works best for you.
Hi, I’m Asena, a Senior Marketing Specialist with over 8 years of experience and a deep passion for trading knowledge. I have a genuine fascination with the world of Crypto and Forex markets. Over the past 6 years, I’ve dedicated myself to writing about technical analysis, fundamental analysis, and the intricate dynamics of these markets. My mission is to provide the most complete and comprehensive data to empower my audience with actionable insights. I truly love what I do and constantly strive to deliver the best possible results for my readers and users.


Asena Taremi