22 Jul

One of the most important tools that has gained prominence for its effectiveness in trend identification and risk management is the SuperTrend indicator.
This powerful tool, rooted in mathematical algorithms, provides traders with valuable insights into prevailing trends and potential reversal points. In this comprehensive exploration, we delve into the intricacies of the SuperTrend indicator, understanding its calculation methodology, interpretation, and practical applications in the ever-evolving world of trading.
Read Trading Strategy: What Is Day Trading Strategy?
What is SuperTrend Indicator:
The SuperTrend indicator is a trend-following tool designed to identify the direction of the prevailing trend and potential entry or exit points. Unlike traditional moving averages, the SuperTrend adapts dynamically to changing market conditions. Its calculation involves considering the average true range (ATR) and multiplying it by a user-defined multiplier. The result is then added to or subtracted from the closing price, creating an upper and lower band that trails the price action.
Explore more: What is Crypto Screener? The Best Crypto Screener

How Does Supertrend Work?
The Supertrend indicator is renowned for its ability to pinpoint precise buy and sell points within a trend. Comprising two lines – one red and one green – this indicator offers insights into the trend direction and optimal trading opportunities. But how does the Supertrend indicator achieve such accuracy?
At its core, the Supertrend indicator utilizes the average true range (ATR) in conjunction with a multiplier to generate its lines. By incorporating both momentum and volatility, the indicator equips traders with valuable signals for market entries. The red and green lines serve as visual cues, signaling when to initiate buy or sell actions based on the prevailing market conditions.
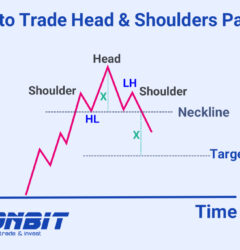
Read more: Trading the Head and Shoulders Pattern: A Complete Guide
Regarding the preferred chart for Supertrend usage, traders have flexibility to apply it across various timeframes where trend formations are perceived. However, it’s essential to note that Supertrend functions as a lagging indicator, meaning its performance is optimized during well-established trends.
In essence, the Supertrend indicator offers traders a powerful tool for navigating the markets, enabling informed decision-making by leveraging insights into trend dynamics and volatility levels.
Read more: What Is Technical Analysis? | Technical Analysis Explained

How to Use Supertrend Indicator in Crypto Trading?
Utilizing the Supertrend indicator in crypto trading can enhance your ability to identify favorable entry and exit points within the market. Understanding how to effectively use the Supertrend indicator is crucial for traders, particularly those new to setting buy and sell signals in the crypto space.
Using the Supertrend indicator is straightforward, as it presents traders with two distinct zones delineated by green and red lines. These lines dynamically change color as the trend transitions from bullish to bearish or vice versa, signaling potential trading opportunities:
- A transition from green to red indicates a sell signal, suggesting a shift from bullish to bearish sentiment.
- Conversely, a transition from red to green signifies a buy signal, indicating a shift from bearish to bullish sentiment.
In addition to signaling buy and sell points, the Supertrend lines serve as effective levels to set stop-loss orders, helping manage risk within your trades.
While this basic approach offers a simple method for trading with the Supertrend indicator, it’s essential to recognize its limitations. The indicator may generate false signals during periods of price consolidation or ranging markets. To mitigate this, traders should explore complementary strategies and indicators to filter out noise and enhance signal accuracy, as detailed in our strategies section below.
Mastering the Supertrend indicator empowers traders with valuable insights into market trends and potential entry and exit points, facilitating informed decision-making and improved trading outcomes in the dynamic world of crypto trading.
Read more: What is Support and Resistance Lines in Trading

Practical Applications in Trading
The SuperTrend indicator finds diverse applications in various trading strategies:
1. Trend Confirmation:
Traders use the SuperTrend to confirm the existence of a trend. A change in the indicator’s color or direction can signify a potential shift in market sentiment, guiding traders in adjusting their positions accordingly.
2. Risk Management:
The SuperTrend’s dynamic nature makes it an effective tool for risk management. Traders can use it to set stop-loss levels, adjusting them based on the changing volatility of the market.
3. Trend Reversals:
SuperTrend signals can help identify potential trend reversals. A shift from a bullish to a bearish signal or vice versa can act as an early indication of changing market dynamics.
4. Intraday Trading:
Day traders often leverage the SuperTrend for intraday strategies. The indicator’s responsiveness to short-term price movements makes it suitable for capturing quick trends within a trading session.

Optimizing SuperTrend for Enhanced Performance
To maximize the effectiveness of the SuperTrend indicator, traders can experiment with different settings, including the ATR period and multiplier. Adapting the indicator to the specific characteristics of the traded asset and timeframe enhances its accuracy. Additionally, combining the SuperTrend with other technical indicators or chart patterns can provide a more comprehensive view of market conditions.
Read more: Pivot Points in Technical Analysis

A Deep Dive into Parameters and Applications
In the dynamic realm of technical analysis, the SuperTrend indicator has emerged as a powerful tool, known for its adaptability and effectiveness in identifying trends and potential reversal points. To harness the full potential of this tool, understanding its key parameters and intricacies becomes crucial for traders seeking precision in navigating financial markets.
Read more: Trading the Inverse Head and Shoulders Pattern: A Comprehensive Guide for Traders
1. Average True Range (ATR):
At the core of the SuperTrend indicator lies the Average True Range (ATR), a volatility measure. ATR quantifies market volatility by considering the average range between high and low prices over a specified period. In the context of the SuperTrend, ATR serves as the foundation for calculating the dynamic bands that trail the price action.
Read more: Price Action Trading: The Art of Trading Without Indicators
2. Multiplier:
The SuperTrend calculation involves multiplying the ATR by a user-defined multiplier. This multiplier allows traders to adjust the sensitivity of the indicator to market volatility. A higher multiplier results in wider bands, making the SuperTrend less sensitive to short-term price fluctuations. Conversely, a lower multiplier tightens the bands, increasing sensitivity to price movements. Traders often experiment with different multiplier values to align the indicator with the specific characteristics of the asset and timeframe they are trading.
3. Calculation Method:
The SuperTrend is calculated by adding or subtracting the product of ATR and the multiplier from the closing price. The formula for the upper band (Bullish) is:
UpperBand=Closing Price+(ATR×Multiplier)
And for the lower band (Bearish):
LowerBand=Closing Price−(ATR×Multiplier)
The dynamic nature of the SuperTrend ensures that the bands adjust in real-time, capturing changes in market volatility and providing traders with relevant levels for trend identification.
4. Signaling and Interpretation:
-
Bullish Signal: When the closing price is above the upper band, the SuperTrend indicates a bullish trend, suggesting potential long positions.
-
Bearish Signal: Conversely, when the closing price falls below the lower band, the SuperTrend signals a bearish trend, indicating potential short positions.
-
Trend Reversals: Changes in the direction or color of the SuperTrend can signal potential trend reversals, offering traders early indications of shifts in market sentiment.
5. Applications in Trading Strategies:
-
Trend Confirmation: Traders use the SuperTrend to confirm existing trends. A change in color or direction of the indicator can signify potential shifts in market sentiment.
-
Risk Management: The dynamic nature of the SuperTrend makes it an effective tool for setting dynamic stop-loss levels, aligning with changing market conditions.
-
Trend Reversals: SuperTrend signals assist in identifying potential trend reversals, allowing traders to adjust their positions accordingly.
6. Optimization and Customization:
Traders often optimize the SuperTrend by experimenting with different settings. This includes adjusting the ATR period and multiplier to match the specific characteristics of the traded asset and timeframe. Combining the SuperTrend with other technical indicators or chart patterns enhances its effectiveness and provides a more holistic view of market conditions.
How to Create A Profitable Supertrend Strategy for Crypto Trading?
Creating a profitable Supertrend strategy for crypto trading begins with identifying whether the market is trending or ranging. Attempting to apply a Supertrend strategy during periods of price consolidation can yield inconsistent results and potentially lead to significant losses.
Once you’ve confirmed a trending market (either upward or downward), you can proceed to develop your Supertrend strategy. The choice of strategy will largely hinge on your preferred trading timeframe. For example, an intraday Supertrend strategy will necessitate frequent buy and sell signals within a single trading day, requiring a shorter timeframe such as 1-minute candles.
Additionally, it’s essential to complement the Supertrend indicator with another indicator to filter out false signals effectively. This combination enhances the strategy’s reliability and improves its performance in varying market conditions.
Now, let’s delve into our curated selection of Supertrend indicator trading strategies to help you navigate the crypto markets with confidence and precision.
Conclusion: Elevating Trading Precision with SuperTrend
In the toolkit of a modern trader, the SuperTrend indicator shines as a versatile and dynamic ally. Its adaptability to changing market conditions, coupled with its simplicity in trend identification, makes it a valuable asset for traders of all experience levels. Whether you are a day trader navigating intraday fluctuations or a swing trader capturing trends over longer periods, the SuperTrend’s applicability spans across diverse trading styles.
As you embark on integrating the SuperTrend into your technical analysis strategy, remember that like any tool, it’s crucial to combine its signals with a thorough understanding of market fundamentals and risk management principles. The SuperTrend indicator, when wielded with precision, becomes not just a tool for spotting trends but a key element in crafting a strategic approach to conquer the challenges of financial markets.