23 Jul

Among the foundational concepts that form the backbone of successful trading strategies are support and resistance lines. In this comprehensive exploration, we delve into the intricacies of these critical elements, understanding their significance, how to identify them, and their application in both Forex and cryptocurrency trading.
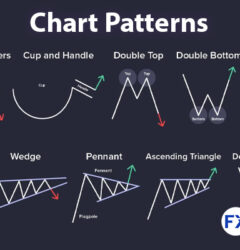
Read More: Trading Chart Patterns: What Are Chart Patterns? + PDF
Support Line: Building a Foundation
Support lines are akin to a financial safety net, representing a price level at which a particular asset tends to stop falling and may even experience a rebound. Picture a trampoline beneath a falling object – the support line acts as that spring, preventing prices from plummeting further. It is a level where buying interest is significantly strong, creating a barrier against further downward movements.
Identifying support lines involves recognizing historical price points where an asset consistently finds buying support. Traders often spot these levels by observing areas where the price has bounced back multiple times in the past. Common technical tools like trendlines, moving averages, and chart patterns can aid in pinpointing potential support zones.
Read more: Advanced Ichimoku Cloud Trading Strategies

Resistance Line: Setting the Ceiling
On the flip side, resistance lines represent a barrier to upward price movements. Think of it as a glass ceiling – prices struggle to break through this level due to heightened selling interest. Resistance lines are established by identifying historical highs where the asset has encountered selling pressure and failed to breach. These lines act as psychological thresholds, indicating a point where sellers may outweigh buyers.
Traders employ a variety of technical indicators and charting techniques to identify resistance levels, including trendlines, Fibonacci retracement levels, and pivot points. Recognizing these barriers is crucial for anticipating potential reversals or breakout opportunities.
Explore Now: The Ultimate Guide to Cryptocurrency 2025

Exploring the Diversity of Support and Resistance Lines in Trading
In the vast landscape of financial markets, the concept of support and resistance lines extends beyond a one-size-fits-all approach. Traders adept at technical analysis recognize the diverse forms these lines can take, each offering unique insights into price dynamics and market behavior. Let’s unravel the multitude of support and resistance variations that traders encounter in the dynamic realms of Forex and cryptocurrency trading.
Read more: Mastering Ichimoku Cloud Trade; Specialized Topics
1. Horizontal Support and Resistance:
The most basic and common form, horizontal support and resistance levels are drawn at the same price level, creating clear barriers for price movements. These levels often represent psychological points where buying or selling interest is concentrated.
2. Diagonal Trendlines:
Trendlines, whether ascending (support) or descending (resistance), connect consecutive lows or highs, respectively. These lines provide a dynamic perspective on the evolving trend, offering traders crucial insights into potential trend reversals or continuations.
3. Fibonacci Retracement Levels:
Derived from the Fibonacci sequence, these levels (23.6%, 38.2%, 50%, 61.8%, and 78.6%) act as potential support or resistance zones. Traders use these levels to identify areas where price may reverse or consolidate.
4. Moving Averages:
Moving averages, such as the simple moving average (SMA) or exponential moving average (EMA), can act as dynamic support or resistance. The 50-day and 200-day moving averages, for instance, are widely watched as indicators of trend strength and potential reversal points.
Find Out More: What is Crypto Automation? Enhancing Trading Precision in the Digital Era

5. Psychological Levels:
Certain price levels ending in double zeros or fifties (e.g., 1.3000 or 50.00) often serve as psychological support or resistance. Traders observe these levels for potential market reactions, as they can influence decision-making based on round numbers.
6. Pivot Points:
Calculated based on the previous day’s high, low, and close, pivot points and their associated support and resistance levels are widely used in intraday trading. They provide reference points for potential price reversals.
7. Volume-Based Support and Resistance:
Support and resistance levels can be identified based on trading volume. High-volume areas may act as support or resistance, indicating significant market interest at those levels.
8. Round Numbers:
Whole numbers or round figures often act as psychological barriers, creating support or resistance levels. Traders pay attention to these levels as they can influence market sentiment.
9. Bollinger Bands:
The upper and lower bands of Bollinger Bands can act as dynamic resistance and support, respectively. Price movements near these bands can signal potential reversals or continuation of trends.
10. Ichimoku Cloud:
The Ichimoku Cloud includes multiple lines, with the Kijun Sen and Tenkan Sen providing dynamic support and resistance levels. Traders use the cloud to identify potential trend direction and reversal points.

Application of Support and Resistance in Trading
-
Trend Identification: Support and resistance lines play a pivotal role in trend analysis. An uptrend is characterized by higher highs and higher lows, with support lines forming the foundation of these ascending lows. Conversely, a downtrend is marked by lower highs and lower lows, with resistance lines acting as a barrier against upward movements.
- Reversal Signals: Support and resistance levels are instrumental in identifying potential trend reversals. A breakout above a resistance level or a breakdown below a support level can signal a change in market sentiment, indicating a potential shift in the prevailing trend.
- Range-Bound Markets: In sideways or range-bound markets, where prices move within a horizontal range, support and resistance lines define the upper and lower bounds. Traders can capitalize on these price ranges by buying near support and selling near resistance.
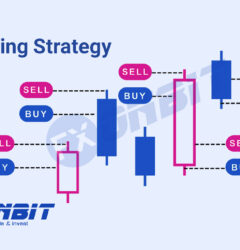
- Entry and Exit Points: Support and resistance levels serve as key reference points for determining entry and exit points. Traders often set buy orders near support levels and sell orders near resistance levels, aiming to capitalize on price bounces or breakouts.
Read more: SuperTrend Indicator in Technical Analysis
Dynamic Nature of Support and Resistance
It’s essential to recognize that support and resistance lines are not static; they evolve as market conditions change. Major economic events, news releases, or shifts in market sentiment can lead to the creation of new support and resistance levels or the alteration of existing ones. Traders must stay vigilant, regularly updating their analyses to reflect the dynamic nature of financial markets.

Tips for Trading with Support and Resistance Lines
-
Confirm with Other Indicators: Combine support and resistance analysis with other technical indicators to strengthen your trading signals. Oscillators like the Relative Strength Index (RSI) or Moving Averages can provide additional confirmation.
-
Consider Timeframes: Support and resistance levels may vary across different timeframes. Ensure consistency by confirming the significance of identified levels on multiple charts.
-
Volume Analysis: Pay attention to trading volume when approaching support or resistance levels. High volume can validate the strength of a price level.
-
Use Price Action Patterns: Incorporate candlestick patterns and chart formations to complement support and resistance analysis. These patterns can offer insights into market psychology and potential price movements.

Read more: What Is Technical Analysis? | Technical Analysis Explained
Conclusion
In the vast tapestry of financial markets, understanding the intricacies of support and resistance lines is akin to possessing a compass that guides traders through uncertain terrain. These fundamental concepts provide invaluable insights into market dynamics, trend reversals, and potential entry or exit points. As traders master the art of identifying and interpreting these critical levels, they gain a competitive edge in navigating the complexities of Forex and cryptocurrency trading. Remember, while technical analysis is a powerful tool, combining it with a thorough understanding of market fundamentals and risk management strategies ensures a well-rounded approach to successful trading in any market environment.

2 Comments
Rouncoor
Can I ask a quick question about your site? https://google.com/?uncoor
Rouncoor
Milad.Barzin.10794
Yes, sure