23 Jul

The Relative Strength Index (RSI) stands as a cornerstone in the toolkit of technical analysts, offering invaluable insights into market momentum and trend reversals. By comprehending its calculation methodology, smoothing effects, and parameter customization, traders can harness RSI’s full potential to refine trading strategies and attain consistent profitability in dynamic market conditions.
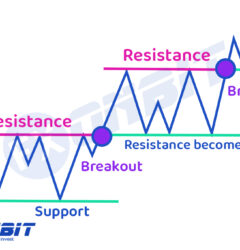
Read it: How to Identify Breakouts by Crypto Screener
Exploring the Relative Strength Index (RSI)
The Relative Strength Index (RSI), crafted by J. Welles Wilder, is a potent momentum oscillator that tracks price movement velocity and magnitude within financial markets. Oscillating between zero and 100, RSI offers key insights into overbought and oversold conditions, while also generating actionable trading signals through divergences, failure swings, and centerline crossovers. Here, we delve into the intricacies of RSI and its pivotal role in technical analysis.
Read more: Unveiling the Key Advantages of Utilizing a Cryptocurrency Screener

Here’s a deeper look into its components and functionalities:
Key Features of RSI
-
Overbought and Oversold Conditions:
- Overbought: When the RSI is above 70, it generally indicates that the asset might be overbought or overvalued, potentially signaling a price reversal or corrective pullback.
- Oversold: When the RSI is below 30, it typically signals that the asset might be oversold or undervalued, suggesting a potential price increase.
-
Trading Signals:
- Divergences: Occur when the price of the asset moves in the opposite direction of the RSI. A bullish divergence happens when the asset’s price makes a new low but the RSI forms a higher low, indicating a potential upward reversal. A bearish divergence occurs when the price makes a new high but the RSI forms a lower high, suggesting a potential downward reversal.
- Failure Swings: Refers to specific patterns where the RSI fails to reach a new high (or low) and then breaks a previous low (or high). This can indicate a potential trend reversal.
- Centerline Crossovers: The RSI crossing above 50 suggests a potential uptrend, while crossing below 50 suggests a potential downtrend.
-
Trend Identification:
- The RSI can also be used to identify the general trend of the market. In an uptrend, the RSI tends to stay above 30 and frequently reach 70. In a downtrend, it tends to stay below 70 and frequently reach 30.
Read More: Trading Chart Patterns: What Are Chart Patterns? + PDF
Notable Contributions and Applications
- Constance Brown: Introduced the concept of bull and bear market ranges for the RSI. In a bull market, RSI typically ranges between 40 to 90 with 40-50 acting as support. In a bear market, RSI ranges between 10 to 60 with 50-60 acting as resistance.
- Andrew Cardwell: Known for his work on positive and negative reversals in RSI. He also provided a different perspective on divergences, highlighting how they could indicate trend continuations rather than reversals.
Explore more: Advanced Technical Analysis: Using Divergences and Convergences for Precision Trading
Historical Context
- Wilder’s Contributions: The RSI was introduced in Wilder’s 1978 book, New Concepts in Technical Trading Systems. This book also presented other influential indicators such as the Parabolic SAR, Average True Range (ATR), and the Directional Movement Index (ADX). Despite being developed before the advent of modern computing, these indicators have remained relevant and are widely used in technical analysis today.
Read more about: What are Bollinger Bands (Complete Guide) + Trading Strategies
Understanding RSI Calculation
RSI’s calculation revolves around three core components:
Relative Strength (RS), Average Gain, and Average Loss, typically computed over a 14-period timeframe, as per Wilder’s recommendation. The process initiates with establishing initial averages of gains and losses over the defined period. Subsequent calculations involve updating these averages based on the latest price movements, employing a smoothing technique akin to an exponential moving average. This normalization ensures that RSI values remain confined within the zero to 100 range, facilitating easy identification of extreme market conditions.
100 RSI = 100 - -------- 1 + RS RS = Average Gain / Average Loss
The Relative Strength Index (RSI) is a momentum oscillator that measures the speed and change of price movements using three basic components: RS (Relative Strength), Average Gain, and Average Loss. The standard calculation period for RSI is 14 periods, as recommended by J. Welles Wilder.
Read More: Top 10 Forex Trading Strategies for Consistent Profits
RSI Calculation Components
-
Average Gain:
- The first average gain is calculated as the sum of gains over the past 14 periods divided by 14.
- For subsequent calculations, the average gain is updated using the formula:
Average Gain=((previous Average Gain×13)+current Gain14)Average Gain=(14(previous Average Gain×13)+current Gain)
-
Average Loss:
- The first average loss is calculated as the sum of losses over the past 14 periods divided by 14.
- For subsequent calculations, the average loss is updated using the formula:
Average Loss=((previous Average Loss×13)+current Loss14)Average Loss=(14(previous Average Loss×13)+current Loss)
-
Relative Strength (RS):
- RS is calculated as the ratio of the average gain to the average loss.
RS=Average GainAverage LossRS=Average LossAverage Gain
- RS is calculated as the ratio of the average gain to the average loss.
Normalization of RS to RSI
The RSI is then derived from RS using the following formula, which normalizes the RS value to oscillate between 0 and 100:
RSI=100−(1001+RS)RSI=100−(1+RS100)
Interpretation of RSI Values
- RSI = 0: This indicates that there have been no gains over the 14 periods; all periods saw a price decrease.
- RSI = 100: This means there have been no losses over the 14 periods; all periods saw a price increase.
Smoothing Technique
The smoothing technique used in updating the average gain and average loss is akin to an exponential moving average (EMA), which gives more weight to recent price changes and ensures that the RSI values become more accurate as the number of data points increases. This technique is crucial for capturing the momentum of price movements and providing a more responsive oscillator.
Practical Considerations
When calculating RSI, at least 250 data points are typically used to ensure the values are accurate and to replicate the results provided by comprehensive charting tools like SharpCharts. This extensive data requirement helps stabilize the initial values and offers a more reliable indicator for analysis.
By understanding these components and their calculations, traders and analysts can better utilize the RSI to identify potential overbought or oversold conditions, spot divergences, and make more informed trading decisions.

The Significance of Smoothing in RSI Values
Smoothing plays a pivotal role in determining the accuracy of RSI values. After the initial calculation, RS values undergo a smoothing process, with subsequent adjustments factoring in both prior averages and current gain/loss. This ensures RSI values may vary based on the total calculation period, with longer periods offering enhanced smoothing effects. Moreover, scenarios where the Average Loss equals zero automatically set RSI to 100, while an Average Gain of zero results in an RSI value of zero.
Tailoring RSI Parameters for Optimal Results
While the default look-back period for RSI is 14, traders possess the flexibility to adjust this parameter to suit varying sensitivity levels and market volatility. For instance, shorter look-back periods like 10 days may yield more frequent overbought or oversold readings compared to longer periods such as 20 days. Additionally, traders can customize overbought and oversold thresholds to align with specific securities or analytical requirements, offering nuanced interpretation of RSI signals.
Read more: Martingale vs. Anti-Martingale Strategies
Optimizing RSI Parameters for Effective Trading Strategies
Short-term traders often leverage alternative RSI parameters, like the 2-period RSI, to efficiently identify extreme market conditions. Adjusting the overbought threshold to 80 and oversold threshold to 20 enables traders to filter out noise and focus on actionable trading opportunities. Ultimately, optimal RSI parameters hinge on factors like security volatility and individual trading objectives, emphasizing the importance of customization in technical analysis.
Read more: Exponential Moving Average (EMA): A Comprehensive Guide for Traders

Understanding RSI Signals and Strategies
Understanding the Relative Strength Index (RSI) and its signals can help traders and analysts identify potential market conditions and reversal points. Here are some key RSI signals and strategies:
Overbought and Oversold Levels
-
Overbought (RSI > 70):
- Indicates that the asset may be overvalued and due for a pullback or correction.
- Example: McDonald’s stock showed an RSI above 70 in mid-September, indicating overbought conditions. Although the price paused, it continued higher, demonstrating that overbought conditions can persist in strong uptrends.
-
Oversold (RSI < 30):
- Suggests that the asset may be undervalued and due for a rebound.
- Example: McDonald’s RSI dipped below 30 in late July, indicating oversold conditions. The stock price bottomed around 44 and then started a bottoming process.
Bullish and Bearish Divergences
-
Bullish Divergence:
- Occurs when the asset’s price makes a lower low, but the RSI makes a higher low. This indicates strengthening momentum and potential reversal to the upside.
- Example: If a stock’s price drops to a new low, but the RSI forms a higher low, this divergence suggests that the selling pressure is weakening and a price reversal may follow.
-
Bearish Divergence:
- Happens when the asset’s price makes a higher high, but the RSI makes a lower high. This indicates weakening momentum and potential reversal to the downside.
- Example: eBay showed a bearish divergence between August and October, with the stock making new highs while RSI formed lower highs. This foreshadowed a breakdown in mid-October.
Read more: Trading the Inverse Head and Shoulders Pattern: A Comprehensive Guide for Traders
RSI Failure Swings
Failure swings are reliable reversal signals that focus solely on RSI movements, independent of price action:
-
Bullish Failure Swing:
- RSI drops below 30, indicating oversold conditions.
- RSI rebounds above 30, then surpasses its previous high, indicating improving momentum.
- Example: Research in Motion (RIMM) may show a bullish failure swing when RSI dips below 30, rebounds, and then breaks above a previous high, suggesting a potential price increase.
-
Bearish Failure Swing:
- RSI exceeds 70, indicating overbought conditions.
- RSI retraces, fails to breach 70 again, and then breaks its prior low, indicating weakening momentum.
- Example: Texas Instruments (TXN) might show a bearish failure swing when RSI exceeds 70, retraces, fails to surpass 70 on the next attempt, and then drops below a previous low, suggesting a potential price decrease.
Practical Use in Trading
-
Trend Confirmation:
- Use RSI levels and movements to confirm trends. In an uptrend, RSI typically stays above 30 and often reaches 70. In a downtrend, RSI usually remains below 70 and frequently hits 30.
-
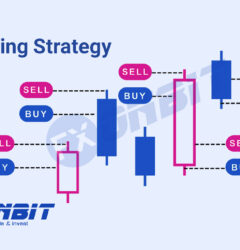
Entry and Exit Points:
- Enter a trade when RSI moves out of oversold or overbought territories. For instance, consider buying when RSI moves above 30 from oversold levels or selling when RSI drops below 70 from overbought levels.
-
Combining Signals:
- Enhance trading strategies by combining RSI signals with other indicators or chart patterns to confirm potential entry and exit points.
By understanding and applying these RSI signals and strategies, traders can make more informed decisions and improve their chances of identifying significant market reversals and trends.
Using RSI to Identify Trends
Using the Relative Strength Index (RSI) to identify trends, especially with the insights from Constance Brown and Andrew Cardwell, can significantly enhance a trader’s ability to make informed decisions. Here’s a closer look at how to apply these advanced RSI concepts:
Bull and Bear Market Ranges for RSI
Bull Market Ranges
- RSI Range: 40-90
- Support Zone: 40-50
- Usage: In a bull market, RSI tends to stay between 40 and 90. The 40-50 zone acts as a support level, indicating low-risk entry points. Traders can look for RSI to rebound from these levels to confirm the continuation of the uptrend.
Read more: Trading the Head and Shoulders Pattern: A Complete Guide
Bear Market Ranges
- RSI Range: 10-60
- Resistance Zone: 50-60
- Usage: In a bear market, RSI usually ranges between 10 and 60, with 50-60 acting as resistance. This range helps traders identify resistance levels and potential points to short or exit long positions.
Positive and Negative Reversals with RSI
Positive Reversal
- Pattern: RSI forms a lower low while the security forms a higher low.
- Indication: This suggests underlying strength in the security despite a lower RSI, indicating a potential upward reversal.
- Example: If MMM shows a lower low in RSI but a higher low in its price, it indicates that the price may soon rise, reflecting hidden strength.
Negative Reversal
- Pattern: RSI forms a higher high while the security forms a lower high.
- Indication: This suggests underlying weakness in the security despite a higher RSI, indicating a potential downward reversal.
- Example: If Starbucks (SBUX) shows a higher high in RSI but a lower high in its price, it indicates that the price may soon fall, reflecting hidden weakness.
Applying RSI Signals and Strategies
-
Trend Identification:
- Use the defined bull and bear market ranges to identify the prevailing market trend. In an uptrend, look for RSI to stay above 40, and in a downtrend, look for RSI to stay below 60.
-
Entry and Exit Points:
- Bull Market: Look for RSI to dip into the 40-50 zone and then rebound as a signal to enter long positions.
- Bear Market: Look for RSI to rise into the 50-60 zone and then retreat as a signal to enter short positions or exit long positions.
-
Reversal Patterns:
- Positive Reversals: Look for opportunities to buy when a positive reversal is identified, signaling hidden strength.
- Negative Reversals: Look for opportunities to sell or short when a negative reversal is identified, signaling hidden weakness.
Practical Examples
Bull Market Example
- Stock: Hypothetical Bull Market Stock
- Scenario: RSI fluctuates between 40 and 90.
- Strategy: Monitor RSI as it approaches the 40-50 support zone. If RSI rebounds from this zone, consider entering a long position.
Bear Market Example
- Stock: Hypothetical Bear Market Stock
- Scenario: RSI fluctuates between 10 and 60.
- Strategy: Monitor RSI as it approaches the 50-60 resistance zone. If RSI retreats from this zone, consider entering a short position or exiting a long position.
Positive Reversal Example
- Stock: MMM
- Scenario: RSI forms a lower low, but the stock forms a higher low.
- Strategy: Identify this as a signal of hidden strength and consider entering a long position.
Negative Reversal Example
- Stock: Starbucks (SBUX)
- Scenario: RSI forms a higher high, but the stock forms a lower high.
- Strategy: Identify this as a signal of hidden weakness and consider entering a short position or exiting a long position.
By incorporating these advanced RSI strategies, traders can better navigate market trends and identify profitable trading opportunities, enhancing their overall decision-making process in the financial markets.
Read more: What is Support and Resistance Lines in Trading
Common Questions About RSI
Can the RSI be applied to different timeframes?
Absolutely. On StockCharts charting platforms, you can integrate the RSI into charts of varying timeframes — daily, weekly, hourly, and even minute charts. The choice of timeframe depends on your specific trading strategy and objectives.
Can the RSI be used as a standalone indicator?
While the RSI offers valuable insights, it’s generally advisable not to rely solely on it. Combining the RSI with other indicators and tools can enhance its effectiveness, helping to confirm signals and reduce the risk of false alarms.
Can the RSI be used in non-trending or sideways market conditions?
Yes, indeed. Even in non-trending or sideways market conditions, the RSI remains relevant. It can help identify potential overbought and oversold conditions, which may indicate impending price swings, even in markets displaying range-bound behavior.
Utilizing RSI in SharpCharts
RSI functionality is available in SharpCharts. By selecting RSI from the Indicator dropdown, users can specify parameters and position (above, below, or behind the underlying price plot). Placing the RSI directly atop the price plot accentuates its movements relative to the price action of the underlying security. Advanced options allow users to smooth the indicator with a moving average or add horizontal lines to mark overbought or oversold levels.

Recommended RSI Scans
RSI Oversold in Uptrend
This scan identifies stocks in an uptrend with oversold RSI. Criteria include stocks positioned above their 200-day moving average to signify an overall uptrend, and RSI crossing below 30 to indicate oversold conditions.
RSI Overbought in Downtrend
This scan pinpoints stocks in a downtrend with overbought RSI reversing downward. Requirements include stocks situated below their 200-day moving average to denote a downtrend, and RSI crossing above 70 to signal overbought conditions. For additional details on the syntax for RSI scans, please refer to our Scanning Indicator Reference in the Support Center.